Best Practice: Development of Robust Shiny Dashboards as R Packages
This blog article is dedicated to creating dashboards. Dashboards are an excellent interactive tool for visualizing raw data, aggregated information, and analytical results. When developing software solutions with R, we at INWT use the shiny package by RStudio.
With shiny you can create apps that act as a standalone web page, or interactive elements that can be included in reports. In addition to the basic development features of R and shiny for dashboards, there are thousands of R packages serving this purpose - with users from a wide range of fields.
The popularity of shiny is based on its flexibility. Both simple and fast-to-develop applications, as well as complex interactive apps with custom CSS and Javascript elements, are possible to create. So, the use of shiny dashboards is attractive for companies of all sizes.
The large and active R community offers many tutorials for learning shiny. To get started, the following pages are useful:
- http://shiny.rstudio.com/tutorial/ provides comprehensive material that is suitable as an entry into shiny app development
- http://shiny.rstudio.com/articles/ presents articles that describe advanced functions and development opportunities
- https://github.com/rstudio/shiny-examples shows an overview of sample apps for inspiration
This blog article won't be another beginner tutorial. Instead, here are INWT's Best Practices for developing robust and automatically-testable shiny dashboards. These are important because when a shiny app grows, the complexity of the code increases, and avoidable sources of error arise.
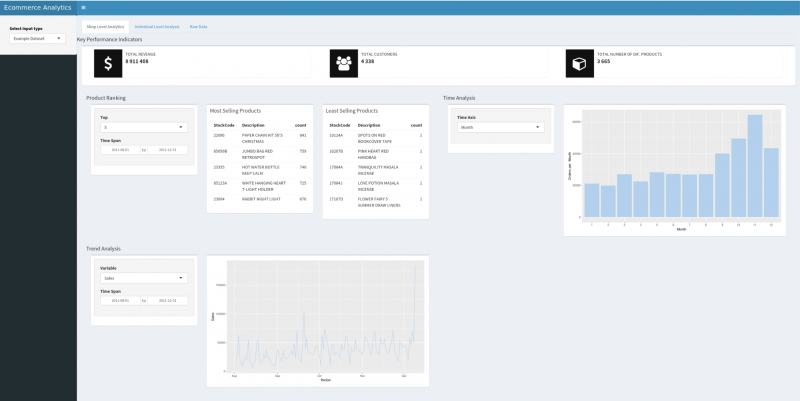
We have created an example to illustrate our best practices in shiny development. These are simple descriptive analyses of ecommerce data that answer questions such as: Which products sell best? At what time do the most purchases occur? How have sales developed since the beginning of the year?
If this were a real customer order, this dashboard could be extended to include more functionality, such as customer segmentation or sales forecasting. The following screenshot shows the finished dashboard:
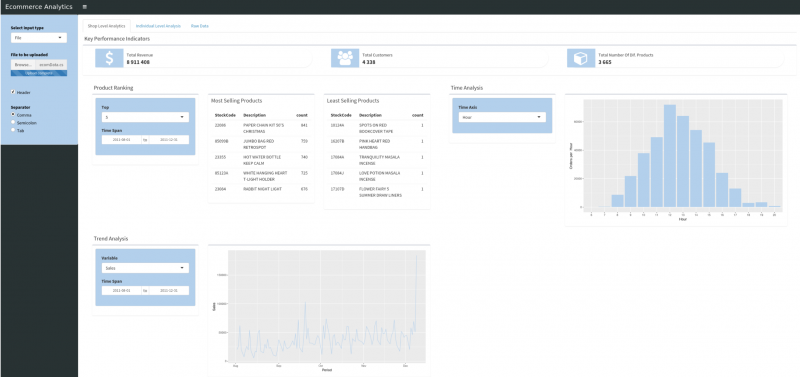 Shiny Dashboard of the ecomAnalytics package
We hosted the dashboard through RStudio's free and publicly-accessible servers. It can be found at the following link: https://inwtlab.shinyapps.io/ecomanalytics/
The code for this dashboard is available on GitHub: https://github.com/INWTlab/ecom-analytics
The sample data analyzed is from a British online retailer: https://archive.ics.uci.edu/ml/datasets/online+retail
Best Practice: Shiny Dashboard Development as a Stand-Alone R Package
Programming your own R packages offers many benefits to both developers and users, and is a major reason for the high level of importance of R within the data science community. The benefits of custom package development are well-suited for application to shiny dashboards. The following list gives some arguments for developing a shiny dashboard within an R package:
Application:
- Installation and updates are automated
- Packages can contain sample data that present the functionality of the dashboard
Development:
- Compliance with formal as well as content quality standards through test-driven development
- Simple distribution of R packages: Dependencies are defined within the package, which are also installed
- Extensive documentation of functions and modules
- Version control
- Re-use of functions and modules for other packages
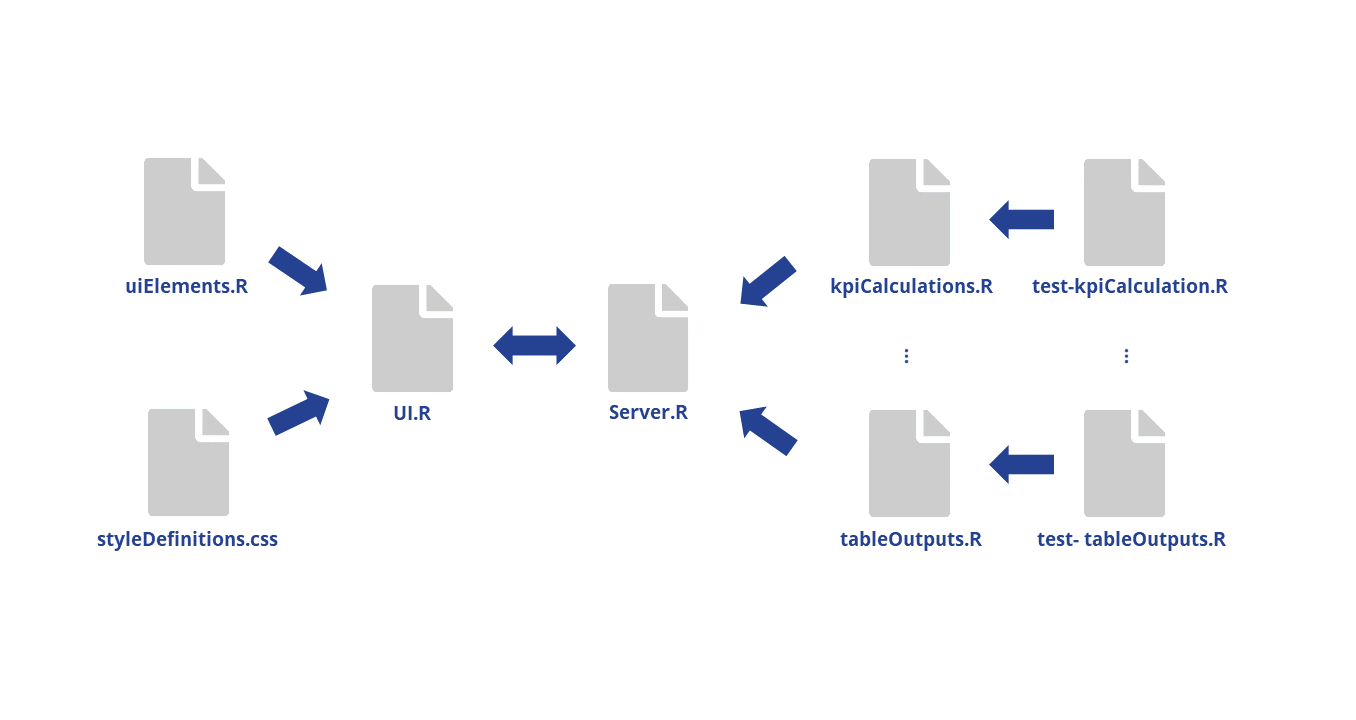
First, we compare the data structure of a conventional shiny app with our best practice structure. Here the contrasting extent of the file structures is already noticeable - an indication of the different possibilities offered by both variants.
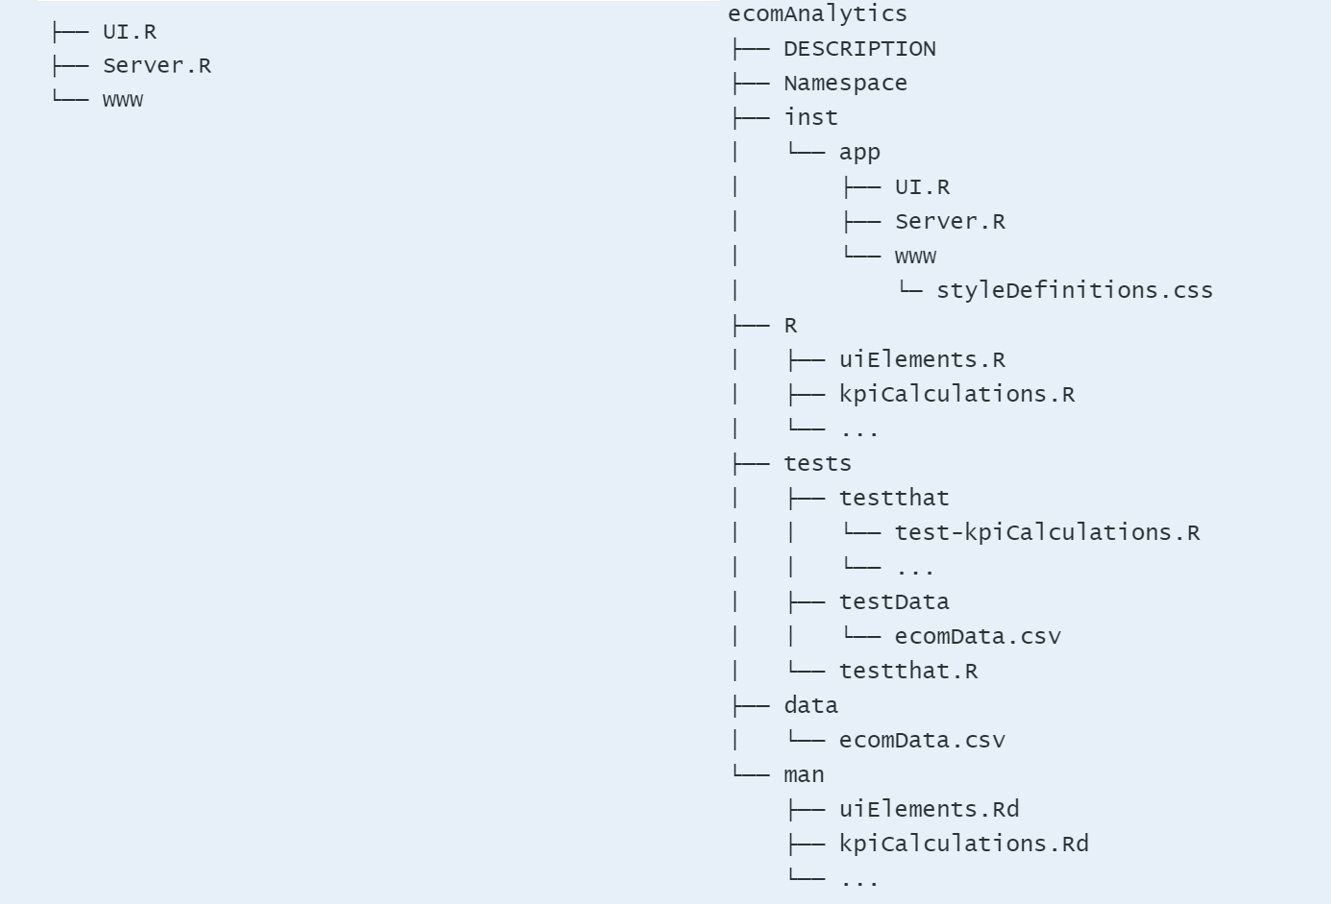 File structures: simple shiny app (left) vs. shiny app in a package (right)
The individual package components perform the following tasks:
ecomAnalyticsis the name of our example package.DESCRIPTIONcontains general information about the package such as the author and maintainer, a package description, or the distribution license. In addition, this file defines packages and their version numbers to be imported and loaded within the project.Namespaceis the place where package dependencies are defined. The file is automatically generated by roxygen2 and lists the packages and functions to import and export.instProvides a location for files to add to the installed package as-is. Here are the base files of a shiny app.Rprovides a directory for additional R files. Functions called withinServer.RorUI.Rare defined here.testscontains the components that the R packagetestthatneeds for automated testing. This includestest-kpiCalculations.Rwithin thetestthatfolder. Here the actual tests are defined.testDatacontains data that are accessed within the test.testthat.Ris created automatically and determines in which directory the tests are executed.datacontains data that are distributed together with the shiny app. These data can be accessed within the shiny Dashboard.manincludes documentation files that inform users about the features of the shiny app
Best Practice: Shiny Development Workflow
Particularly when structuring shiny apps in package form, it is often not clear which order of development is the right one. There is no "one true" shiny development workflow, but for us at INWT, the following best practice workflow has been proven.
Once:
1. Create R package
The first step is to create an R package. This can easily be done within R with the following commands:
usethis::create_package("ecomAnalytics")
Subsequently, the DESCRIPTION file is filled in, and additional required directories, such as inst or data are added manually. The following line creates a test directory plus a test file that we need for a robust dashboard:
usethis::use_test("kpiCalculations")
The goal is to create a structure like the right side of the schema above. Missing files may be added manually.
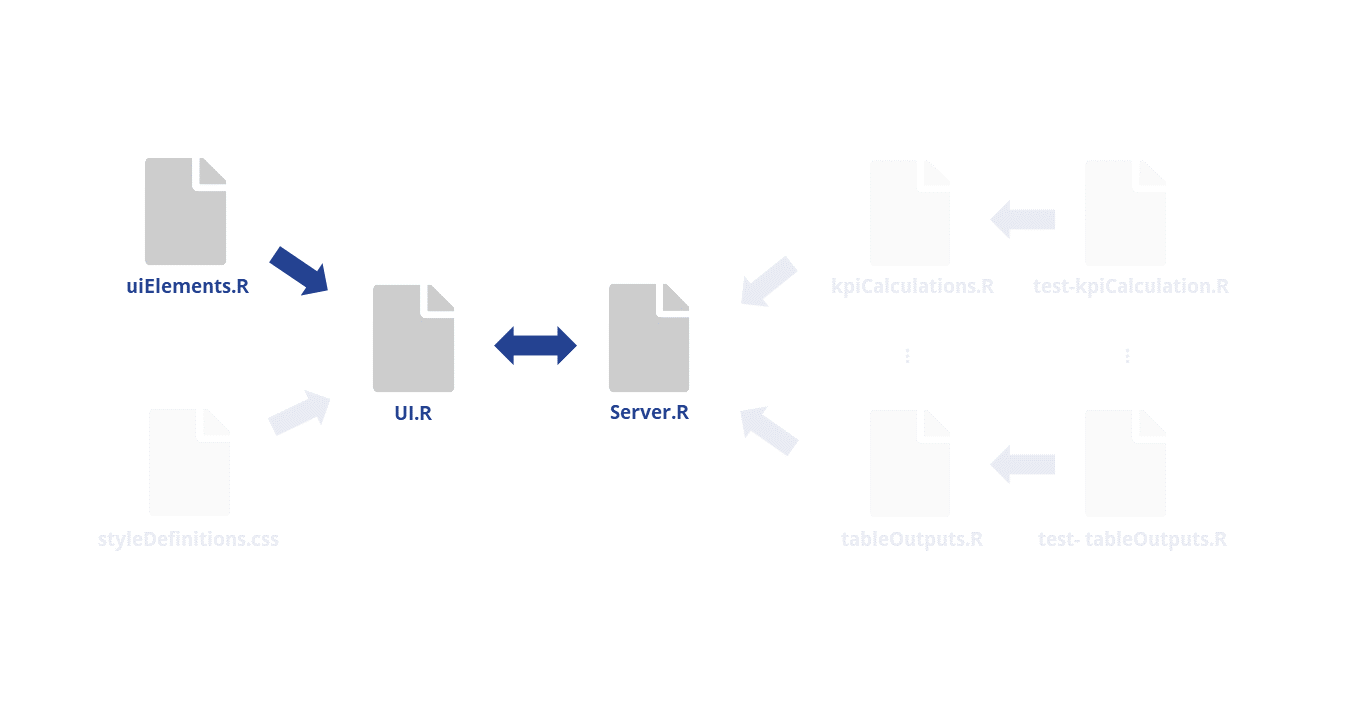
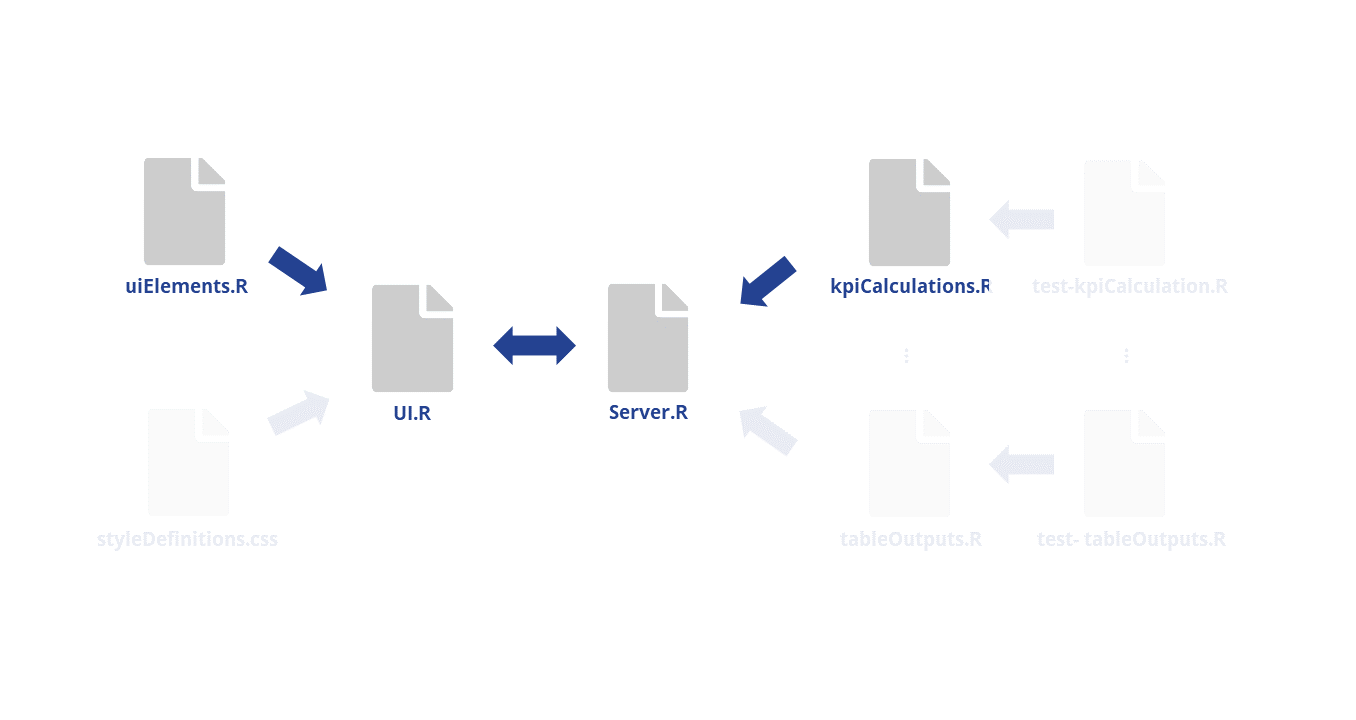
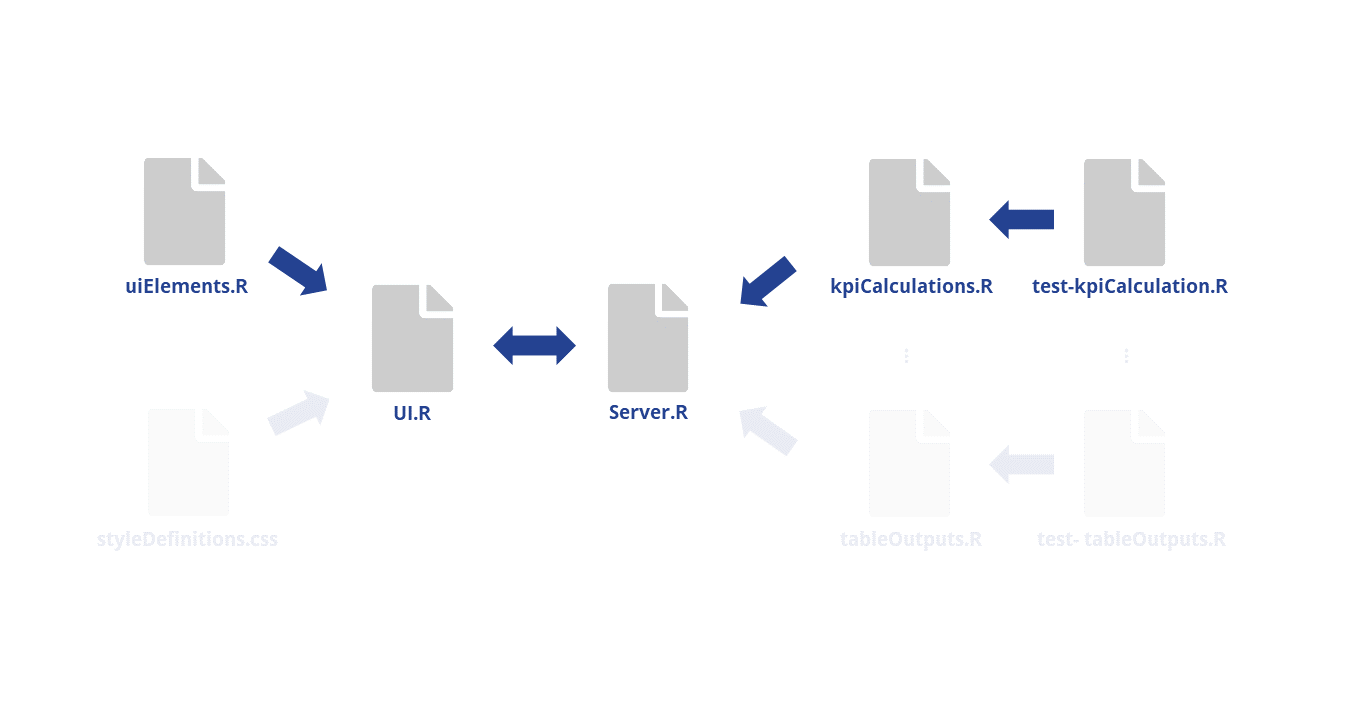
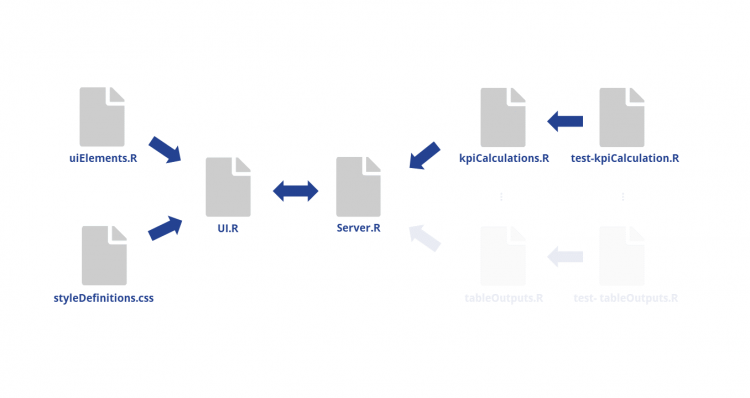
2. Understand the Structure and Interaction of the Files
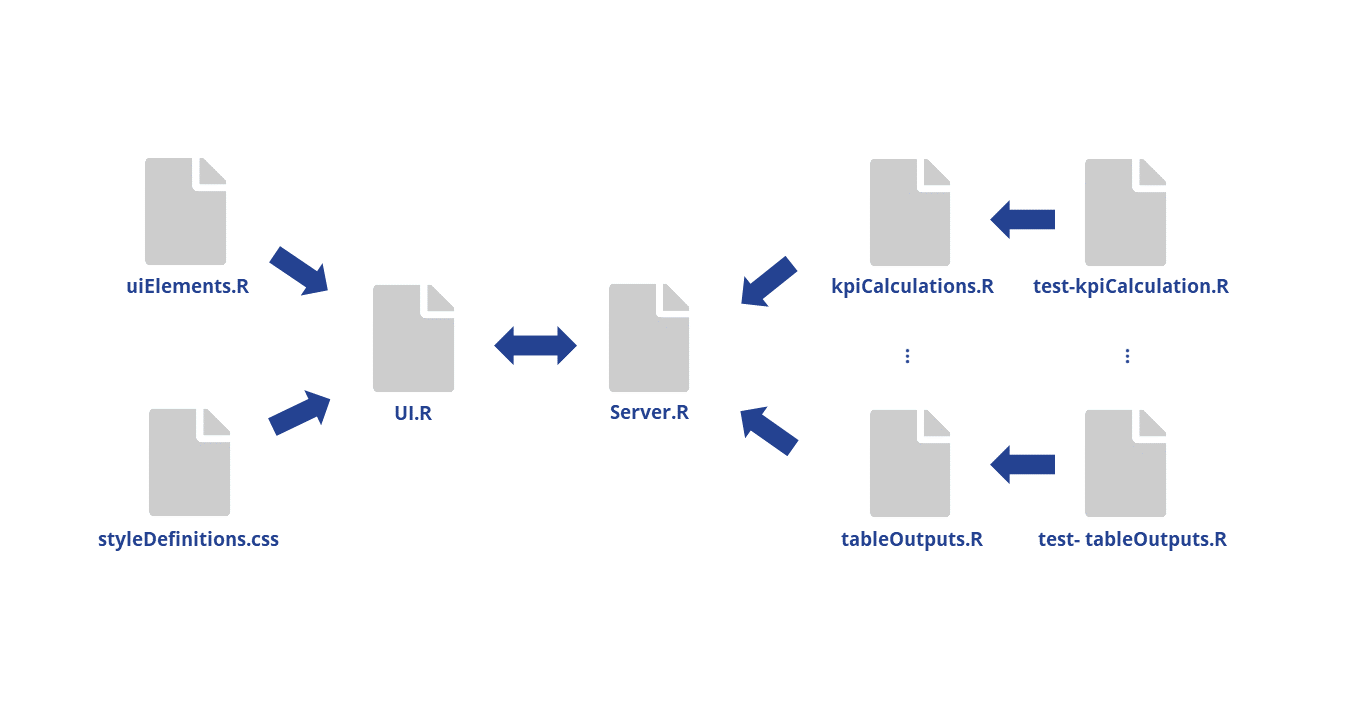
Before programming actual content, it is important to understand the purpose of each file and how it interacts with each other file. Let's stay with the example of the Ecommerce Analytics Dashboard. The above overview puts the files of the ecomAnalytics package in context.
The two most important elements of an app are UI.R and Server.R. The dashboard is eventually created from these two files. As the name implies, UI.R defines the User Interface. Server.R calculates the shiny dashboard.
If the size of the project to be created is small, it may be enough to put all the code in these two files. As the number of functions increases, however, this variant might become quite confusing, difficult to maintain, and prone to error. Therefore, we use an extended structure. In doing so, we follow the principle of excluding any logic and complex code sections from UI.R and Server.R. There, only functions should be called, which are supplied from auxiliary files. This increases the clarity within projects enormously.
uiElements.R contains the individual blocks of the user interface, which are then called in UI.R. styleDefinitions.css is the place where all the color, font, and design options are defined that are different from the default values.
Located behind Server.R is e.g. kpiCalculations.R. This sample file is named after the group of functions that it contains. These functions are called within Server.R. For each group of functions, it makes sense to create a test file with an analogous name, e.g. test-kpiCalculations.R. Here, tests are written to the respective functions, which guarantee the correct functionality.
If the functionality of a project increases, the amount of auxiliary files increases, but the central files remain slim, which is key.
Repeatedly:
The following cycle is run through for a function or group of related functions. Once you have gone through the workflow once again, it begins again with a new functionality starting from this step. The process ends as soon as all desired functions are implemented, and can be easily resumed as soon as the app is extended.
3. Build a Visual Skeleton
In inst/app/UI.R, the visual framework is started. Dashboard creation uses the package shinydashboard. We divide the file into three parts: a header, a sidebar, and a body. The three tabs that the ecomAnalytics example shows are found in the body.
The associated code looks like this:
#UI.R

dashboardPage(
    header  = panelTitle(...),                                      #*
    sidebar = dashboardSidebar(panelSelectInput, ...),              #*
    body    = dashboardBody(...,
            tabPanel("Shop Level Analytics", value = "tab1",        #*
                shopLevelKpis(),                                    #*
                shopLevelProductRanking(),                          #*
                shopLevelTimeAnalysis(),                            #*
                ...),
            tabPanel("Individual Level Analytics", value = "tab2",  #*
                ...),
            tabPanel("Raw Data", value = "tab3",                    #*
                ...)
            )
    )
Most of the functions and tabs that are called here have not yet been defined (lines marked with '# *'). Our workflow first thinks in terms of which components the dashboard should have, names them here, and then defines them.
So that UI.R remains clear, especially in large projects, we outsource the definitions of these ui elements.
4. Create UI Elements

In R/uiElements.R the elements are now defined and exported, which are called in UI.R. This is the external appearance, as the name suggests. Of the placeholders that were used for functions in step 3, the function shopLevelKpis() is defined below as an example:
#uiElements.R

#' @export
#' @rdname uiElements
shopLevelKpis <- function() {
  fluidRow(
    h4("Key Performance Indicators"),
    box(width =  12,
        infoBoxOutput('revenueKpi', width = 4),
        infoBoxOutput('customersKpi', width = 4),
        infoBoxOutput('numProductsKpi', width = 4)
    ))
}
Here it has been defined that the element shopLevelKpis should be a series consisting of three info boxes. The actual calculation is still missing and will be done in the next step.
5. Define Server Structure
inst/app/Server.R is the place for any shiny app calculations. First, functions should be written for each ui element to enable the technical functioning of the app. It's not about writing correct functions yet.
Now the required counterpart to the previously-defined ui element shopLevelKpis() should be defined:
#Server.R

getRevenueKpi <- reactive({
    revenue <- 1000000
    revenue
  })

output$revenueKpi <- renderPrint({
    revenue <- getRevenueKpi()
    infoBox(title = "Total Revenue", revenue, icon = icon("dollar"),
        color = "black", width = 12)
  })
First, a reactive function getRevenueKpi(), with a notional value of 1 million, is defined. Within the render function, the reactive function is called. In infoBox(), final details are defined.
The fictitious revenue value can now be retrieved via output$revenueKpi. Afterwards, the correct calculation can be programmed.
Note: It is also possible to jump back to step 3 at this point and first develop all functions with fictitious values, and then continue with steps 5-7.
6. Create Content Functionality
For correct results, first data are loaded. In our example, this is done with the reactive function getRawData():
#inst/app/Server.R

getRawData <- reactive({
    req(input$file1)
    ecomData <- read.csv(input$file1$datapath,
                         header = input$header,
                         sep    = input$sep)
    ecomData
  })
Then, the already-created function getRevenueKpi() will be improved. Data are loaded and stored as an ecomData object. The data object, in turn, is used as an input to calcRevenueShop(), an outsourced function that calculates the revenue of the entire store and returns revenue.
#inst/app/Server.R

getRevenueKpi <- reactive({
    if(!is.null(input$file1)){
        ecomData <-getRawData()
        revenue  <- calcRevenueShop(ecomData)
    } else {
        revenue <- '0'
        }
    })
calcRevenueShop() itself is not very complicated and can be found in the helpfile R/kpiCalculations.R.
#R/kpiCalculations.R

#' @export
#' @rdname kpiFunctions
calcRevenueShop <- function(ecomData) {
  format(round(ecomData %>% select('Sales') %>%  sum()), big.mark = ' ')
}
The render function that creates output$revenueKpi can be left unchanged.
#inst/app/Server.R

output$revenueKpi <- renderPrint({
    revenue <- getRevenueKpi()
    infoBox(title = "Total Revenue", revenue, icon = icon("dollar"),
        color = "black", width = 12)
  })
In this sense, any function that is already technically working is now also made meaningful in terms of content. After completing this phase, you already have a shiny app that works and produces valid results.
There is ony still potential in terms of robustness and style. The next two steps are dedicated to the best practice workflow.
7. Write Unit Tests
Using automated tests in R packages is an important part of the development process. Writing automated tests means more overhead in the short-term, but minimizes long-term debugging and guarantees robust shiny dashboards - especially for high-complexity dashboards. The best practices for automated tests in the shiny context essentially cover two areas: formal testing and content testing.
The former checks the technical functionality, whereas the latter guarantees that outputs are plausible in terms of content. Test 1 guarantees that no empty object is issued, test 2 controls that the desired format is transmitted (with no decimal places), and test 3 checks that revenue is a positive number, as negative revenue is not plausible:
#tests/testthat/test-kpiCalculations.R

test_that("Correct Revenue KPI Output for Shop Level Analytics", {
    ...
    revenue <- calcRevenueShop(ecomData)

    testthat::expect_true(!is.null(revenue)         #test 1
    testthat::expect_true(!grepl('\\.', revenue))       #test 2
    testthat::expect_true(revenue > 0)          #test 3
})
Use the following command to run the tests:
devtools::test()
8. Define Style
8.1
There are several ways to incorporate style information in shiny. It is crucial for us that any style definitions are stored in CSS files. This can be done in a single file, like styleDefinitions.css in this example, or in several UI files. These definitions then flow into the UI.R, where they will be implemented.
8.2
This is what the dashboard looks like without the use of a custom style. Although the standard layout of a shiny dashboard looks by no means bad, there are often special requests or the desire for optics, e.g. consistency with the corporate identity of a company.
8.3
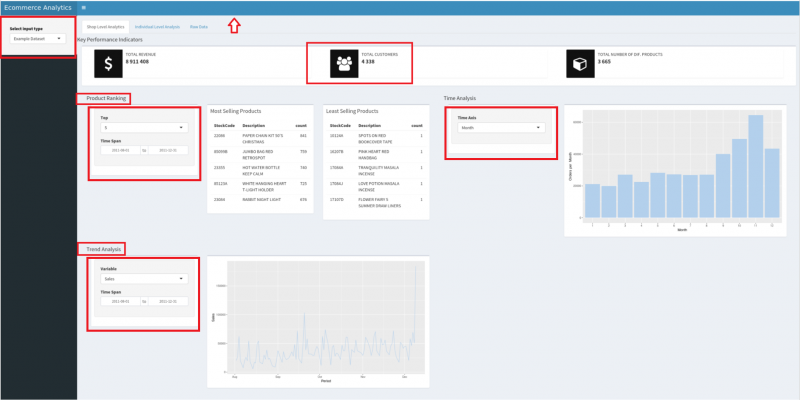
If we'd like to have a dashboard in a style that suits the CI of INWT, we would like to change some things. We've marked some examples that we would like to customize. For example, we would like:
- The header and the icons of the key performance indicators to be in light blue, like the bars of the histogram
- All input fields also in light blue
- The sub-headings at the same height as the top headline
8.4
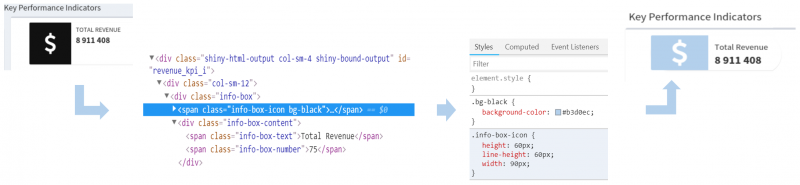
Using the example of the info boxes, we show how to customize the style information. The form, font, and color should be changed.
To find the appropriate CSS commands, first go to the source code of the dashboard (right-click, then click Inspect). In inspect mode you now move over the piece whose style should be adjusted. This will mark the corresponding HTML code and you will also get the CSS information used for this particular piece. Now, you can modify the CSS information on a test basis, and observe the reaction directly in the browser.
The code shows the adjustments just described. The new CSS information is now simply stored in the styleDefinitions.CSS file. The next time the app is loaded, the new user interface will be created, taking into account the new settings:
#inst/app/www/styleDefinitions.css

.info-box {
  min-height: 60px; border-radius: 30px;
}

.info-box-icon {
  height: 60px; line-height: 60px; width: 90px;
}

.info-box-content {
  padding-top: 10px; padding-bottom: 0px;
}

.info-box-text {
  text-transform: capitalize;
}.bg-black {   background-color: #b3d0ec!important; }
8.5
After adding the new style information, the dashboard looks like this. The color scheme is adapted to the CI of INWT and is consistent. In addition, all fields for user input are highlighted in light blue and promote the intuitive operation of the dashboard.
9. Repetition
The last step of the workflow is to repeat this sequence until all desired functionalities have been developed.
The list of helper files is growing, but UI.R and Server.R remain slim, apart from a larger number of function calls.
Summary of our Principles
- Create shiny dashboards within an R package. What looks like a major effort at first pays off as the size of a project increases, because the package structure can be flexibly expanded without having to compromise on the clarity.
- Remove any complexity from the main files (
UI.RandServer.R). Write separate functions and modules, save them in auxiliary files, and get slimUI.RandServer.Rfiles, where only function calls take place. - Write tests for your outsourced functions. Automated formal and content review of their features makes it easy to maintain a high level of quality.
Following these principles will help you to create a slim and clear shiny dashboard that can be flexibly expanded while being resilient to errors.
Feedback
Do you have any comments or suggestions for improving the design of the ecomAnalytics package and the best practices used? If so, just create an issue on Github or submit a pull request.