Debugging in R: How to Easily and Efficiently Conquer Errors in Your Code
When you write code, you’re sure to run into problems from time to time. Debugging is the process of finding errors in your code to figure out why it’s behaving in unexpected ways. This typically involves:
- Running the code
- Stopping the code where something suspicious is taking place
- Looking at the code step-by-step from this point on to either change the values of some variables, or modify the code itself.
Since R is an interpreter language, debugging in R means debugging functions.
There are a few kinds of problems you’ll run into with R:
- messages give the user a hint that something is wrong, or may be missing. They can be ignored, or suppressed altogether with
suppressMessages(). - warnings don’t stop the execution of a function, but rather give a heads up that something unusual is happening. They display potential problems.
- errors are problems that are fatal, and result in the execution stopping altogether. Errors are used when there is no way for the function to continue with its task.
There are many ways to approach these problems when they arise. For example, condition handling using tools like try(), tryCatch(), and withCallingHandlers() can increase your code’s robustness by proactively steering error handling.
R also includes several advanced debugging tools that can be very helpful for quickly and efficiently locating problems, which will be the focus of this article. To illustrate, we’ll use an example adapted from an excellent paper by Roger D. Peng, and show how these tools work along with some updated ways to interact with them via RStudio. In addition to working with errors, the debugging tools can also be used on warnings by converting them to errors via options(warn = 2).
traceback()
If we’ve run our code and it has already crashed, we can use traceback() to try to locate where this happened. traceback() does this by printing a list of the functions that were called before the error occurred, called the “call stack.” The call stack is read from bottom to top:
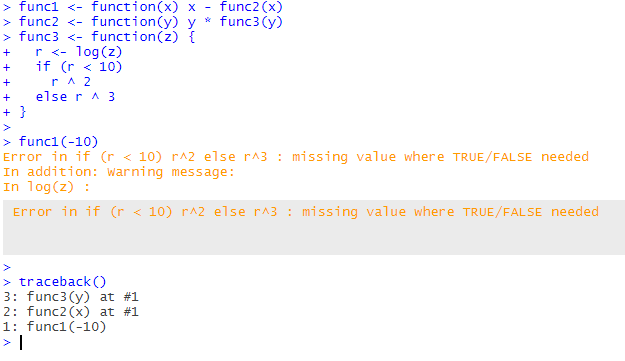
traceback() shows that the error occurred during evaluation of func3(y).
Another way we can use traceback(), besides inserting it directly into the code, is by using traceback() as an error handler (meaning that it will call immediately if any error occurs). This can be done using options(error = traceback).
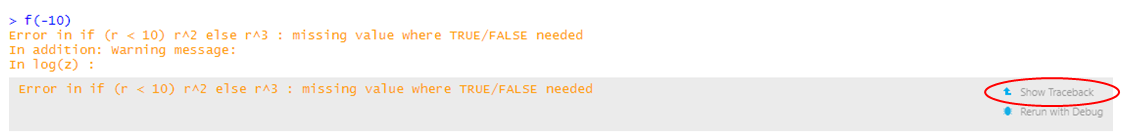
We can also access traceback() directly through the button on the right-hand side of the error message in RStudio:
Debug Mode
While traceback() is certainly useful, it doesn’t show us where, exactly, an error occurred within a function. For this, we need “debug mode.”
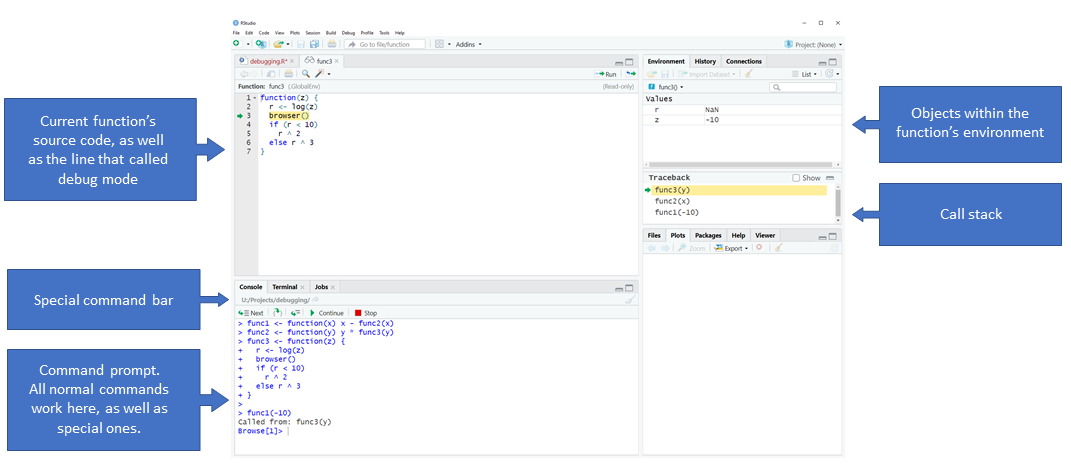
Entering debug mode will pause your function and let you examine and interact with the environment of the function itself, rather than the usual global environment. In the function’s runtime environment you’re able to do some useful new things. For example, the environment pane shows the objects that are saved in the function’s local environment, which can be inspected by typing their name into the browser prompt.
You can also run code and view the results that normally only the function would see. Beyond just viewing, you’re able to make changes directly inside debug mode.
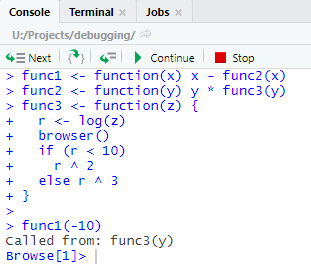
You’ll notice that while debugging, the prompt changes to Browse[1]> to let you know that you’re in debug mode. In this state you’ll still have access to all the usual commands, but also some extra ones. These can be used via the toolbar that shows up, or by entering the commands into the console directly:
ls()to see what objects are available in the current environmentstr()andprint()to examine these objectsnto evaluate the next statementsto step into the next line, if it is a function. From there you can go through each line of the function.- where to print a stack trace of all active function calls
fto finish the execution of the current loop or functioncto leave the debug mode and continue with the regular execution of the functionQto stop debug mode, terminate the function, and return to the R prompt
Debug mode sounds pretty useful, right? Here are some ways we can access it.
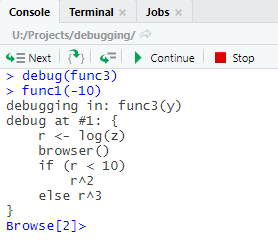
browser()
One way to enter debug mode is to insert a browser() statement into your code manually, allowing you to step into debug mode at a pre-specified point.
If you want to use a manual browser() statement on installed code, you can use print(functionName) to print the function code (or you can download the source code locally), and use browser() just like you would on your own code.
While you don’t have to run any special code to quit browser(), do remember to remove the browser() statement from your code once you’re done.
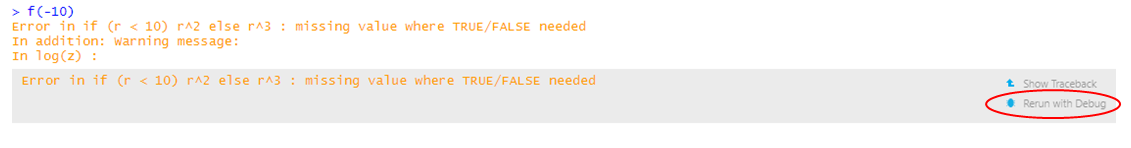
debug()
In contrast to browser(), which can be inserted anywhere into your code, debug() automatically inserts a browser() statement at the beginning of a function.
This can also be achieved by using the “Rerun with Debug” button on the right-hand side of the error message in RStudio, just under “Show Traceback.”
Once you’re done with debug(), you’ll need to call undebug(), otherwise it’ll enter debug mode every time the function is called. An alternative is to use debugonce(). You can check whether a function is in debug mode using isdebugged().
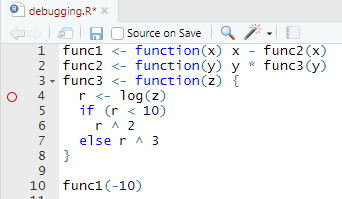
Options in RStudio
In addition to debug() and browser(), you can also enter debug mode by setting “editor breakpoints” in RStudio by clicking to the left of the line in RStudio, or by selecting the line and typing shift+F9. Editor breakpoints are denoted by a red circle on the left-hand side, indicating that debug mode will be entered at this line once the source is run.
Editor breakpoints avoid having to modify code with a browser() statement, though it is important to note that there are some instances where editor breakpoints won’t function properly, and they cannot be used conditionally (unlike browser(), which can be used in an if() statement).
You can also have RStudio enter the debug mode for you. For example, you can have RStudio stop the execution when an error is raised via Debug (on the top bar) > On Error, and changing it from “Error Inspector” to “Break in Code.”
To prevent debug mode from opening every time an error occurs, RStudio won’t invoke the debugger unless it looks like some of your own code is on the stack. If this is causing problems for you, navigate to Tools > Global Options > General > Advanced, and unclick “Use debug error handler only when my code contains errors.”
If you just want to invoke debug mode every single time there’s ever an error, use options(error = browser()).
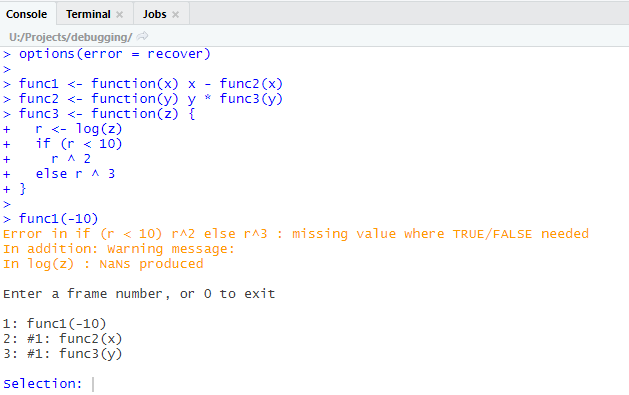
recover()
recover() is similar to browser(), but lets you choose which function in the call stack you want to debug. recover() is not used directly, but rather as an error handler by calling options(error = recover).
Once put in place, when an error is encountered, recover() will pause R, print the call stack (though note that this call stack will be upside-down relative to the order in traceback()), and allow you to select which function’s browser you’d like to enter. This is helpful because you’ll be able to browse any function on the call stack, even before the error occurred, which is important if the root cause is a few calls prior to where the error actually takes place.
Once you’ve found the problem, you can switch back to default error handling by removing the option from your .Rprofile file. Note that previously options(error = NULL) was used to accomplish this, but this became illegal in R 3.6.0 and as of September 2019 may cause RStudio to crash the next time you try running certain things, such as .Rmd files.
trace()
The trace() function is slightly more complicated to use, but can be useful when you don’t have access to the source code (for example, with base functions). trace() allows you to insert any code at any location in a function, and the functions are only modified indirectly (without re-sourcing them).
The basic syntax is as follows:
trace(what = yourFunction,
      tracer = some R expression,
      at = code line)
In order to figure out which line of code to use, try: as.list(body(yourFunction))
Note that if called with no additional arguments beyond the function name, trace(yourFunction) just prints the function message:
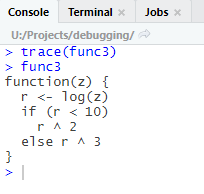
Let’s try it out:
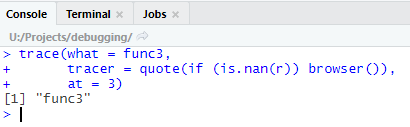
Now our function func3() is an object with tracing code:
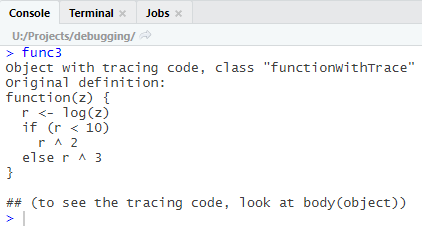
If we want to see the tracing code to get a better understanding of what’s going on, we can use body(yourFunction):
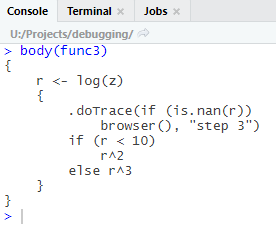
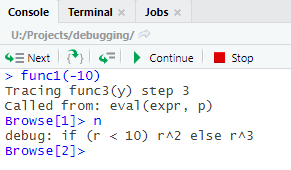
At this point, if we call on the function func1(), debug mode will open if r is not a number.
When you’re done, you can remove tracing from a function using untrace().
And that’s it! These methods may seem a bit confusing at first, but once you get the hang of them, they will be an important tool to help you quickly and efficiently overcome (inevitable) bugs in your code.