Business Case: Spatial Data Visualization
Data Visualization: Spatial Distribution of Bundestag Election Results
Task
The Berlin-Brandenburg Statistical Office intended to carry out a graphical analysis of the 2017 Bundestag election results for Berlin on election night. Of particular interest was where parties within Berlin had performed particularly well or particularly poorly. The spatial distribution of the respective voting shares was to be presented as detailed as possible - independent of the summary of electoral districts.
The classical approach is to use “choropleths,” or area value step cards, which show the voting shares for each constituency classified by color on a map:
Choropleth map: Percentage of votes for die Linke
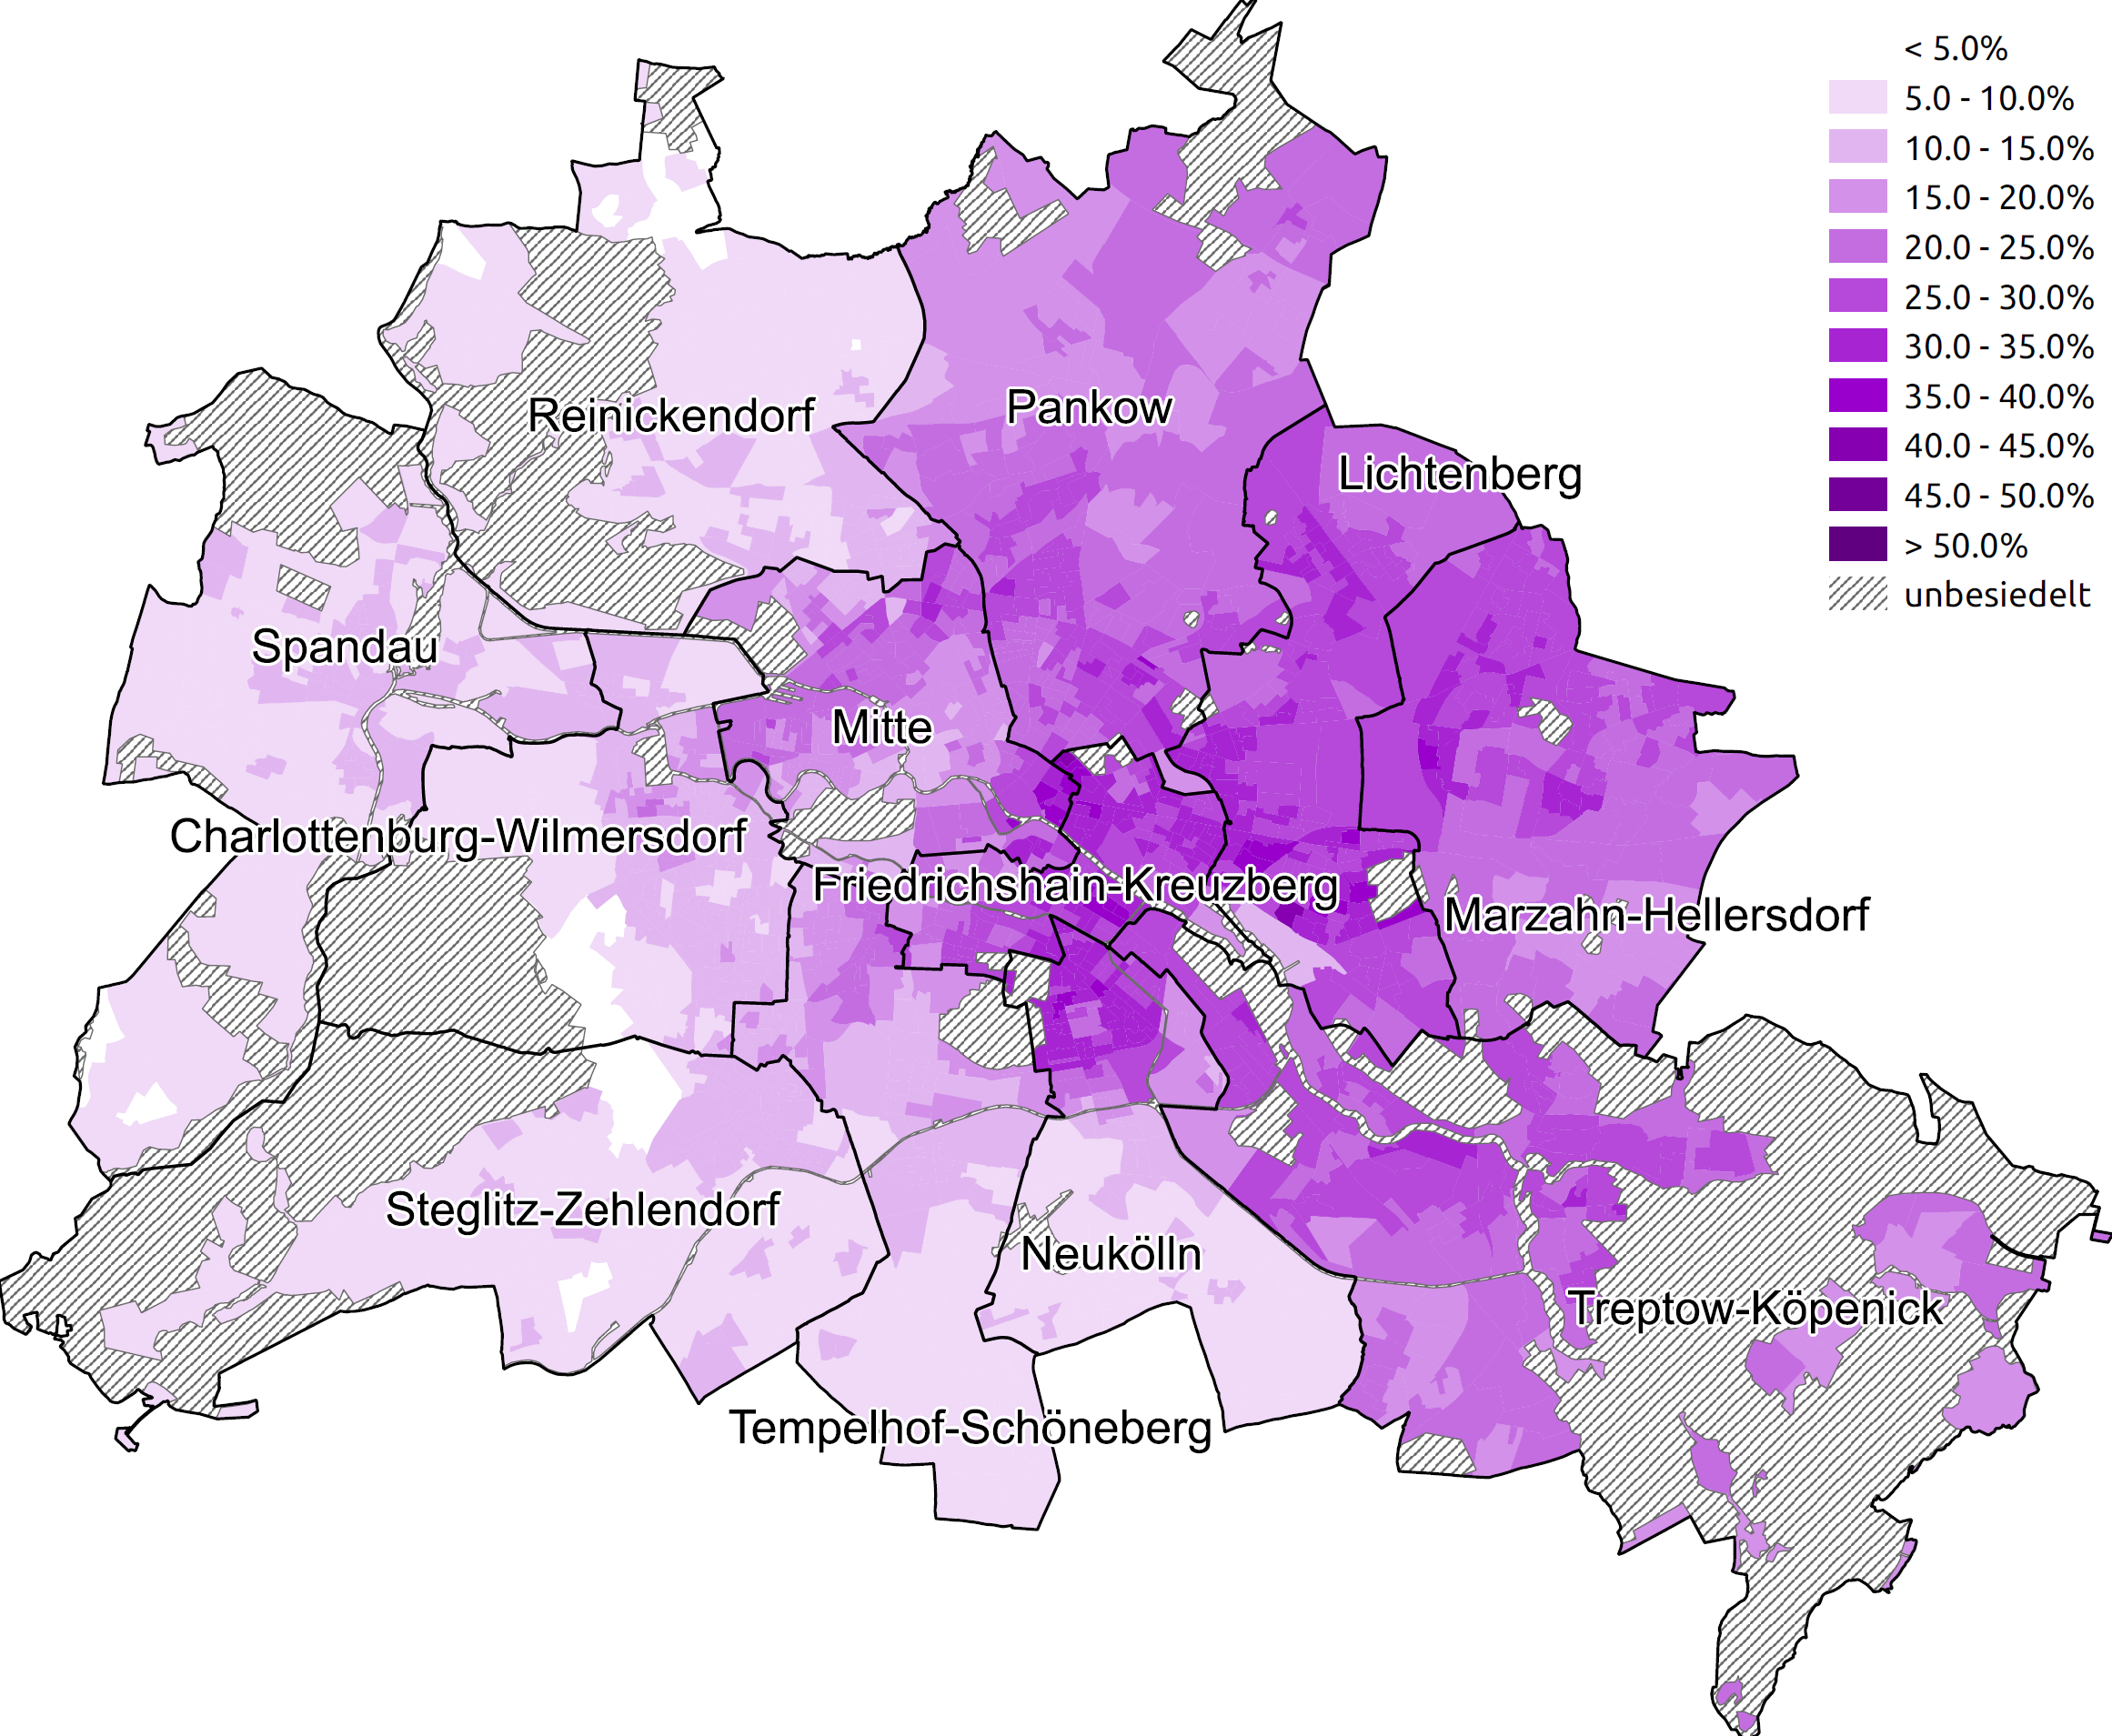 Map calculation and production Kerstin Erfurth, EMOS student, Freie Universität Berlin and the Berlin-Brandenburg Statistical Office.
However, this form of presentation has several disadvantages. For example, areas - in this case, constituencies - are represented as uniform in color, which they often are not. In addition, the different sizes and sometimes intricate shapes of constituencies lead to visual distortion. In addition, information is lost through the classified representation, since even small changes lead to a different coloring of the map, which is particularly problematic with a comparison over time.
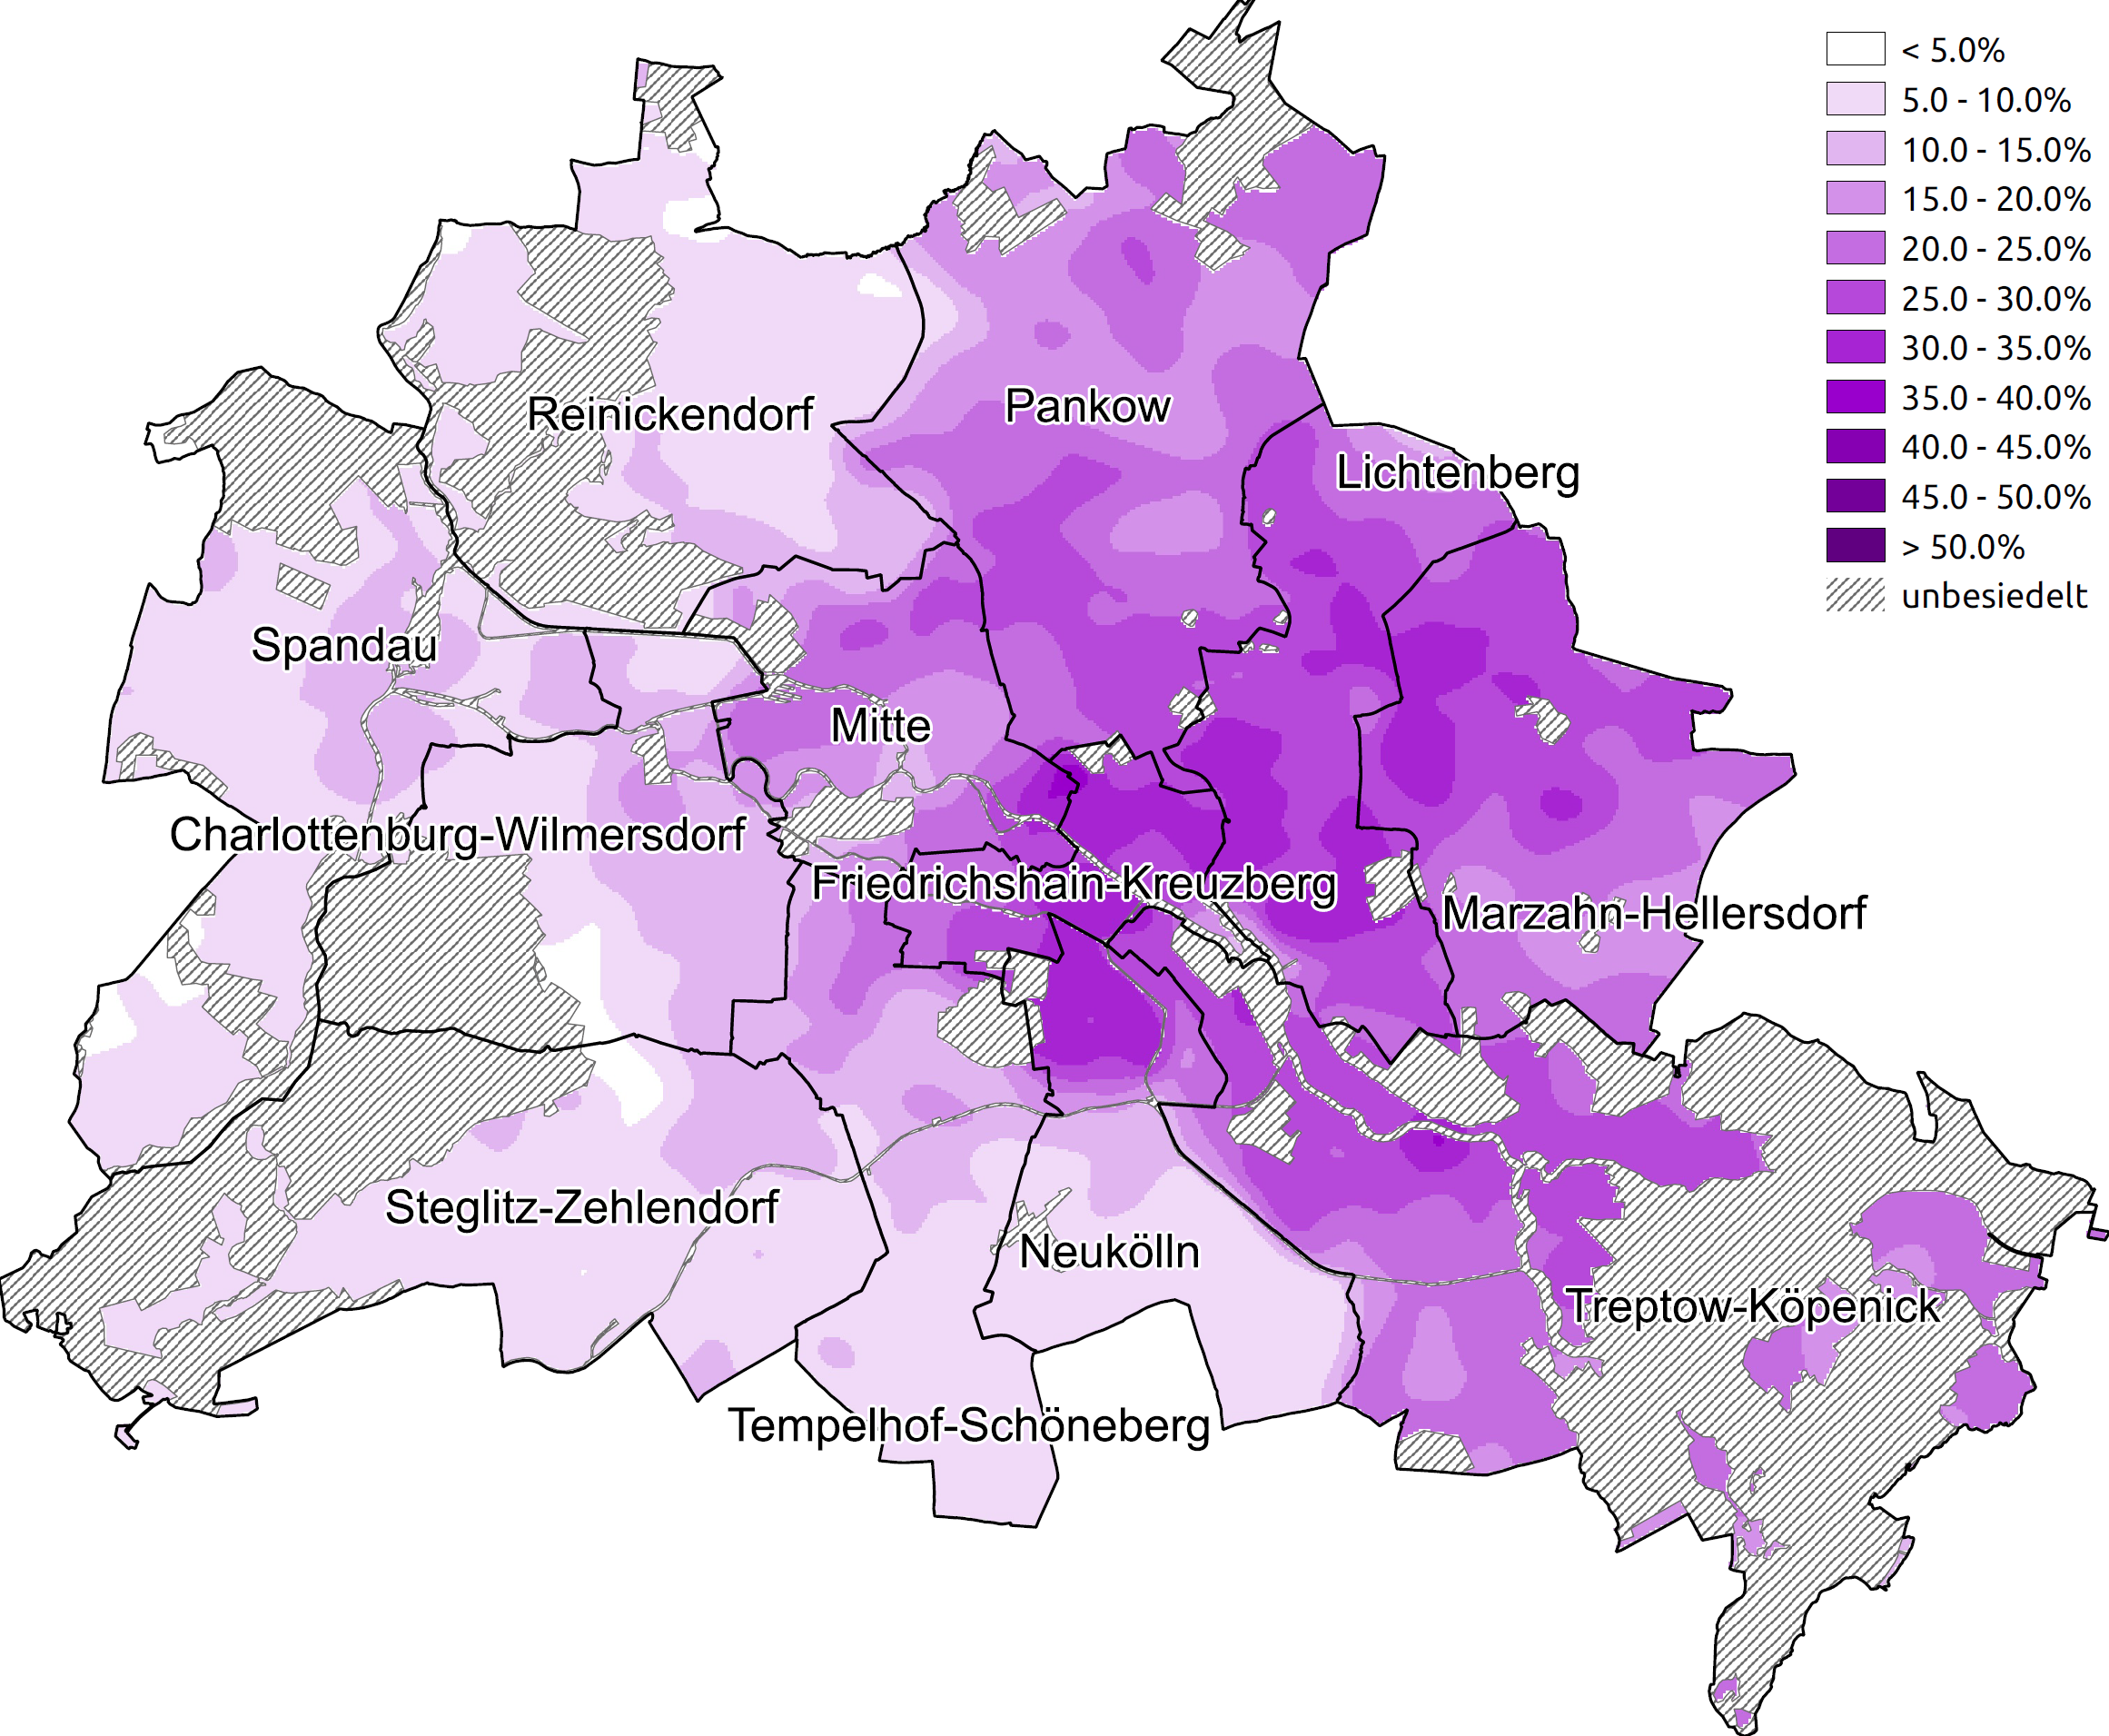
We sought a method without these disadvantages. The method of “core density estimation” enables a spatially smooth estimation over the constituencies and a graphical representation of the analysis question. The innovative method called kernel heaping, which allows this method to be applied to spatially summarized data, was developed by Dr. Marcus Groß (INWT), Prof. Dr. Timo Schmid (FU Berlin), and Prof. Dr. Ulrich Rendtel (FU Berlin).
Data
The analysis is based on the results of the 2017 Bundestag elections in Berlin, which are available for the ballot box districts and the absentee ballot districts. For subsequent use, the data and geometries were entered into the open data portal daten.berlin.de by the Berlin-Brandenburg Statistical Office.
Analytics
Kernel heaping allows the estimation of proportions (e.g. vote proportions) based on data aggregated for subareas (e.g. constituencies). In the course of this procedure an SEM (Stochastic Expectation Maximization) algorithm is applied, which generates “pseudo samples” in an iterative procedure. These form the basis for the actual estimation. The R-package of the same name for methodology was developed by Dr. Marcus Groß, and made freely available on CRAN. As a new feature, uninhabited areas like the Tiergarten, Grunewald, or Tempelhofer Feld were excluded from the estimation.
Solution
The novel method of kernel heaping provides new insights into the spatial distribution of votes. With this form of representation, the strongholds of the individual parties within Berlin are much more visible to the viewer than with conventional choropleth maps, since they are no longer dependent on the structure of the constituencies. Choropleth maps show the spatial differences very inaccurately with a coarse resolution, e.g. because of district boundaries. On the other hand, a very high resolution provides an unusably noisy image. The kernel heaping method, on the other hand, is based on core density estimation, which provides an optimal balance between the two extremes. The Statistical Office was able to produce core density maps of the election results with the procedure on election night, and publish them on short notice.
Links
- Blog series about the accompanying R package Kernelheaping
- Office for Statistics Berlin-Brandenburg
- Report of the State Election Commissioner: Election to the 19th German Bundestag on 24 September 2017, pp. 67-71
- Election results for Berlin
- Publicly available R-package Kernelheaping
- Research article: doi:10.1111/rssa.12179
- Freie Universität Berlin
- European Master in Official Statistics (EMOS)