Evaluation of the Election Forecast 2025
The 2025 federal election is over and the results are in. The parties received the following vote shares:
| Party | Vote Share (%) |
|---|---|
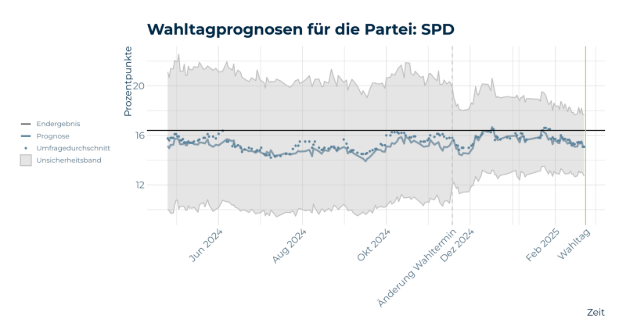
| SPD | 16.4 |
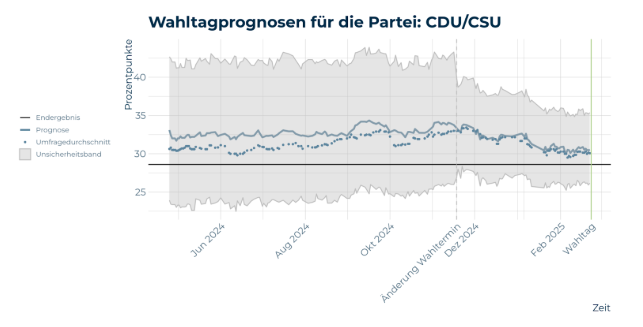
| CDU/CSU | 28.6 |
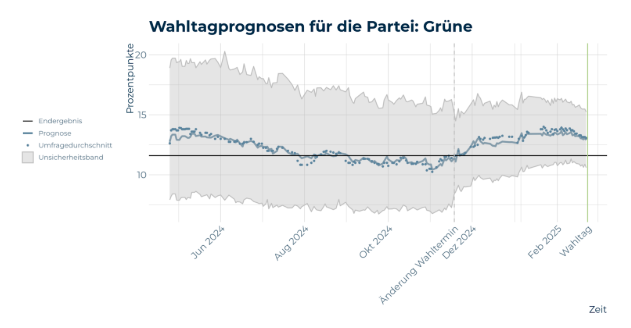
| Greens | 11.6 |
| FDP | 4.3 |
| AfD | 20.8 |
| Left | 8.8 |
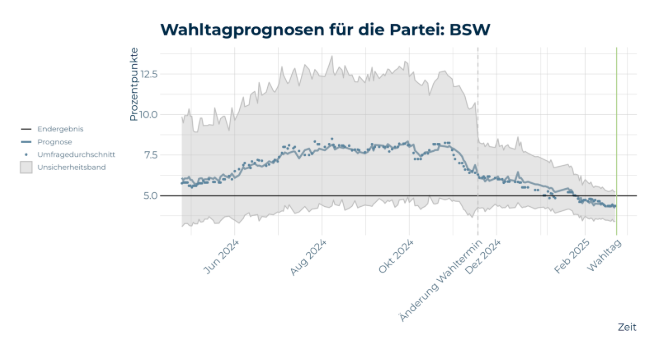
| BSW | 4.9 |
Table 1: Vote Shares of Parties
This is the third time we at INWT have created forecasts for the federal election. How well did our model ultimately perform? In this blog article, we examine various aspects of our forecast and reflect on the strengths and weaknesses of the model.
Since the federal elections in 2017 and 2021, not only has the political landscape changed, but we have also continuously developed our model. For example, we have significantly reduced the runtime with the help of the cmdstanr software and integrated the BSW as a new party. We have also developed a coalition model that calculates probabilities for different coalitions. You can find more information about the innovations in the FAQs on our website. We have described the new coalition model here.
Mean Forecast Error
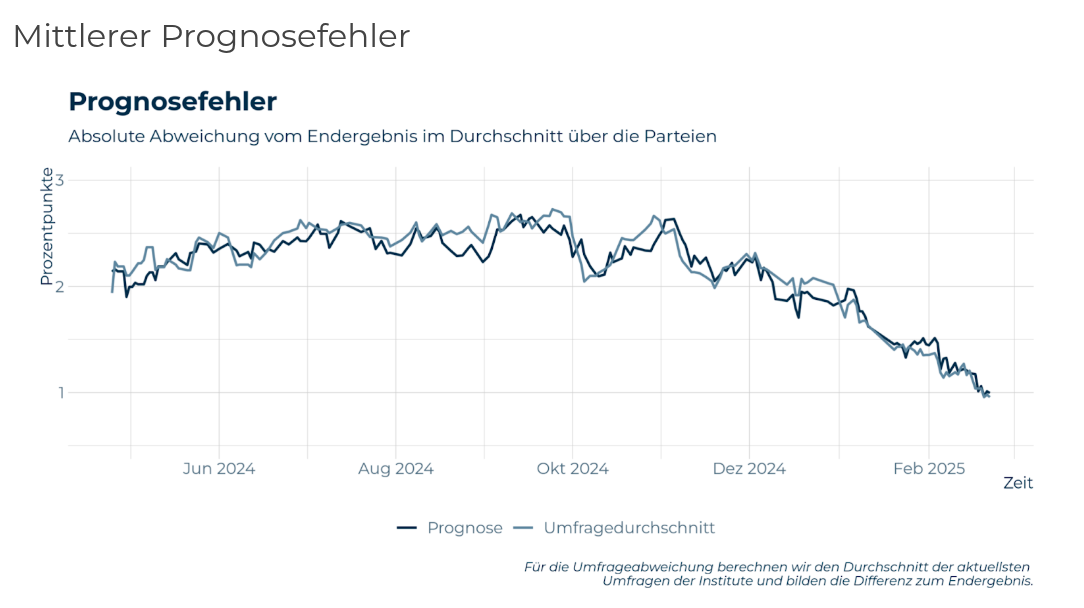
Figure 1: Forecast Error
For a highly aggregated evaluation of our forecast, we average the absolute deviation from the final result across all parties in Figure 1. For example, our forecast on the day before Christmas was on average 1.9 percentage points away from the final result, while the average of the polls was 2.1 percentage points away. On the day before the election, the average of the polls had a mean error of 0.97 percentage points and our forecast error was one percentage point. These two examples illustrate what can also be seen in Figure 1: Depending on the time, the average of the polls or the forecast was better, there is no clear winner here. It is also noticeable that the forecast error increased somewhat over the summer before it decreased again. This is strongly driven by the forecast for the BSW, whose values were temporarily over 8%. In the end, however, the new party did not make it over the 5% hurdle. Table 2 contains the absolute deviations from the final result, averaged over time, for the individual parties.
| Party | CDU/CSU | SPD | Greens | Left | BSW | FDP | AfD |
|---|---|---|---|---|---|---|---|
| INWT Prediction | 3.8 | 1.2 | 1.0 | 5.1 | 1.7 | 0.4 | 1.6 |
| Poll Average | 2.7 | 0.9 | 1.2 | 5.3 | 1.6 | 0.5 | 2.8 |
| Most Recent Poll | 2.5 | 1.0 | 1.2 | 5.2 | 2.1 | 0.6 | 2.7 |
Table 2: Forecast errors in percentage points. Absolute deviations from the final result averaged over time since April 1, 2024. Third row: At each point in time, the absolute deviations of the latest poll from the final result are also calculated and averaged over time.
The impression from the time series in Figure 1 is confirmed. For CDU/CSU, SPD, and BSW, our forecast is on average less accurate than the poll average. For Greens, Left, FDP, and AfD, our forecast is more accurate.
Evaluation of Event Probabilities
The decisive added value of our model is that uncertainty intervals and event probabilities are calculated, which is not possible with a simple average of the poll values. The event probabilities are listed in table 3. All events for which our model calculated a probability of more than 50% on the day before the election occurred. These include events such as "Majority for the grand coalition" (74.4%) and "Left has more votes than the FDP" (99.8%). Also, the events with less than 50% probability did not occur, such as Black-Green having a majority (45.9%) or the FDP entering the Bundestag (14.1%).
| Event Description | Event Probability (%) |
|---|---|
| Majority for "Kenya" (Black-Red-Green) | 100.0 |
| CDU becomes the strongest faction | 100.0 |
| Left gets more votes than FDP | 99.8 |
| Left enters the Bundestag | 99.6 |
| The Greens enter the Bundestag | 99.4 |
| AfD becomes the second strongest faction | 97.3 |
| Majority for grand coalition | 74.4 |
| Majority for Black-Green | 45.9 |
| FDP enters the Bundestag | 14.1 |
| Greens stronger than SPD | 13.7 |
| Majority for "Germany" (Black-Red-Yellow) | 12.5 |
| Majority for "Jamaica" (Black-Green-Yellow) | 11.5 |
| BSW enters the Bundestag | 8.5 |
| Majority for Blackberry Coalition | 7.4 |
| Majority for Union-Greens-BSW | 7.3 |
| SPD gets more than 20% of the votes | 0.3 |
| CDU/CSU gets more than 40% of the votes | 0.1 |
| Majority for "Traffic Light" (Red-Yellow-Green) Coalition | 0.0 |
Table 3: Event Probabilities on the Day Before the Election, February 22, 2025.
Probability of a Black-Red Majority
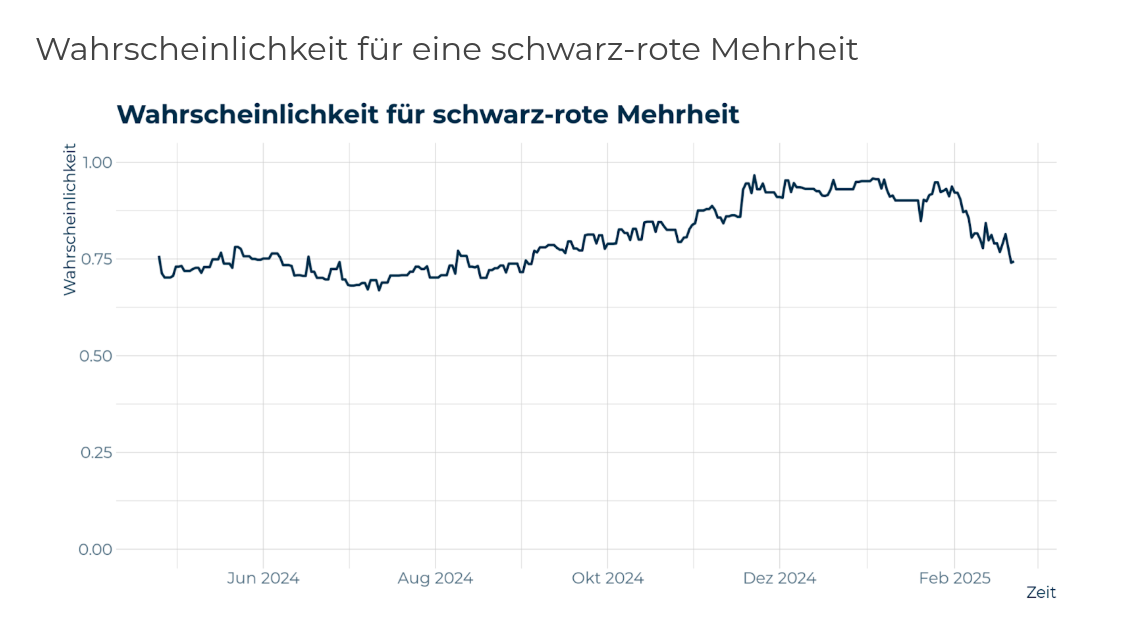 Figure 2: Black-Red Majority
As another example, Figure 2 shows the time course of the probability that we calculate for a Black-Red majority. Whether the grand coalition would be possible was not clear until the end, as it depended, among other things, on whether smaller parties such as BSW and FDP would make it over the 5 percent hurdle. The graph shows that this factor played a strong role from the beginning of February 2025, as the probability drops sharply here. Before that, there was a phase from December 2024 in which CDU/CSU and SPD were so strong in the forecast that their majority hardly depended on the performance of BSW and FDP. Overall, we draw the positive conclusion that we assessed the probability realistically several months before the election.
Coalition Forecast
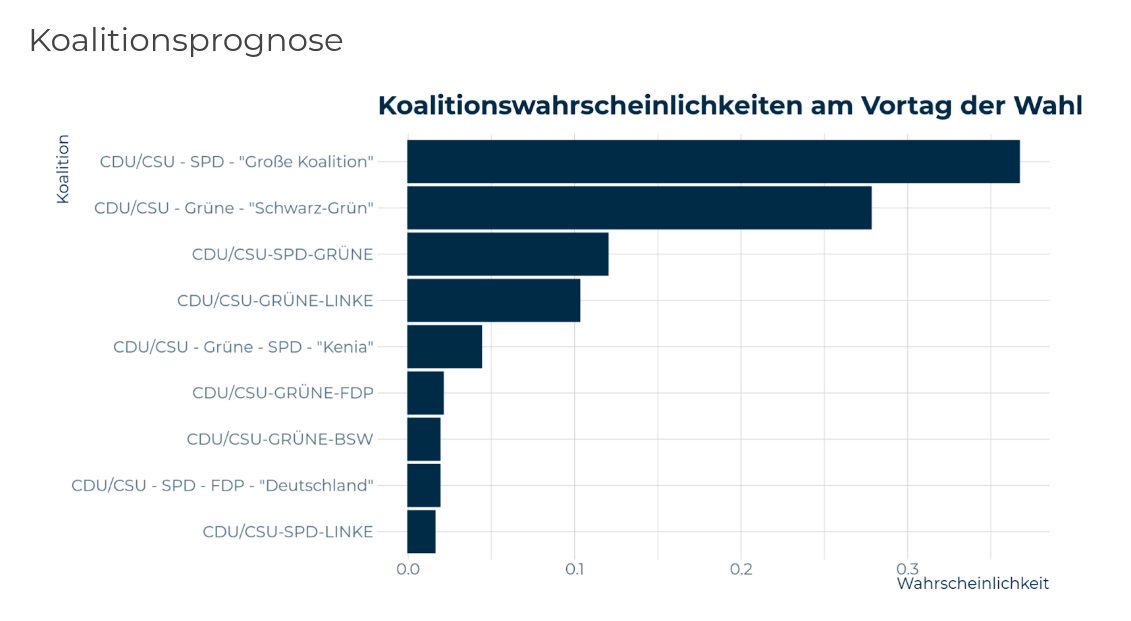
Figure 3: Coalition Probabilities
Our coalition forecast is based on the previously created election vote forecast and the information on which parties have already formed coalitions with each other at the federal and state levels. In Figure 3, we show the coalition probabilities on the day before the election. The top 3 probabilities seem plausible in view of the election results. For example, the probability for a grand coalition is estimated at 36.7%. It is noticeable that the probability for a purely mathematical Black-Red majority is estimated at 74.4% (see Figure 3), but this is not equivalent to a similarly high probability for the actual formation of a coalition. For example, the event "Majority for Black-Green" also has a probability of 45.9%, so such a coalition is quite possible. This is reflected in the coalition probabilities in Figure 3. Generally speaking, the probability for a coalition of CDU/CSU, Greens, and the Left with 10.3% seems rather high, considering that the CDU has so far categorically ruled out a coalition with the Left. Possibly, this model result is driven by the fact that at least Greens and Left have already formed coalitions with each other, such as in the past Red-Red-Green coalition in Thuringia. The model works purely data-based and does not consider statements from parties.
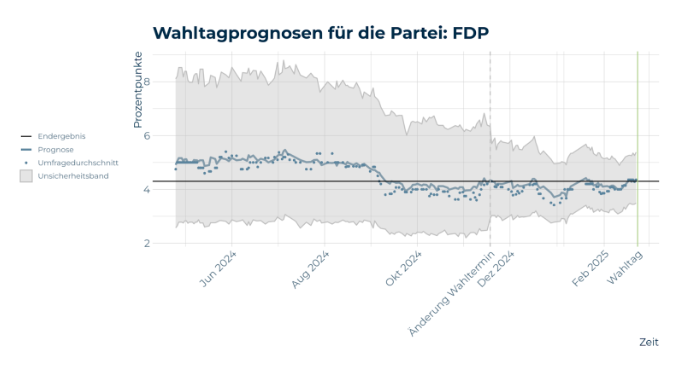
Forecasts for Individual Parties
Now we look at the forecasts for individual parties over time. The graphs for all parties can be unfolded in the box further below. It should be noted that we only created forecasts for the new election date on February 23, 2025, from November 13, 2024 onwards - after the "traffic light" coalition broke down. Before that, the forecasts still refer to the originally scheduled date of September 28, 2025. This can be seen, for example, in Figure 4 for the Left when examining the uncertainty band, which becomes narrower after November. The time distance between the forecast date and election day had significantly decreased due to the early election, which also makes the forecast uncertainty smaller. The uncertainty bands in the figures indicate the interval in which the final result will lie with 95% probability. In the figures for the individual parties, it can be seen that the final results for all parties are within the 95% confidence intervals at all times, except for the Left. On the day before the election (the last forecast day), the true result (8.8%) is just outside the upper limit of the uncertainty interval (8.78%). If it is assumed that the vote shares are independent of each other, it is to be expected that 5% of 7, i.e., for less than one party, the vote share lies outside the 95% confidence interval. This fulfills a plausibility check that our model assesses the uncertainty validly and the intervals are neither much too wide nor too narrow. Which parties were particularly difficult to predict? The Left, in particular, recorded strong gains in the forecast in the last few weeks before the election. In Figure 4, it can be seen that their result was still significantly underestimated by 5 to 6 percentage points between August 2024 and January 2025.
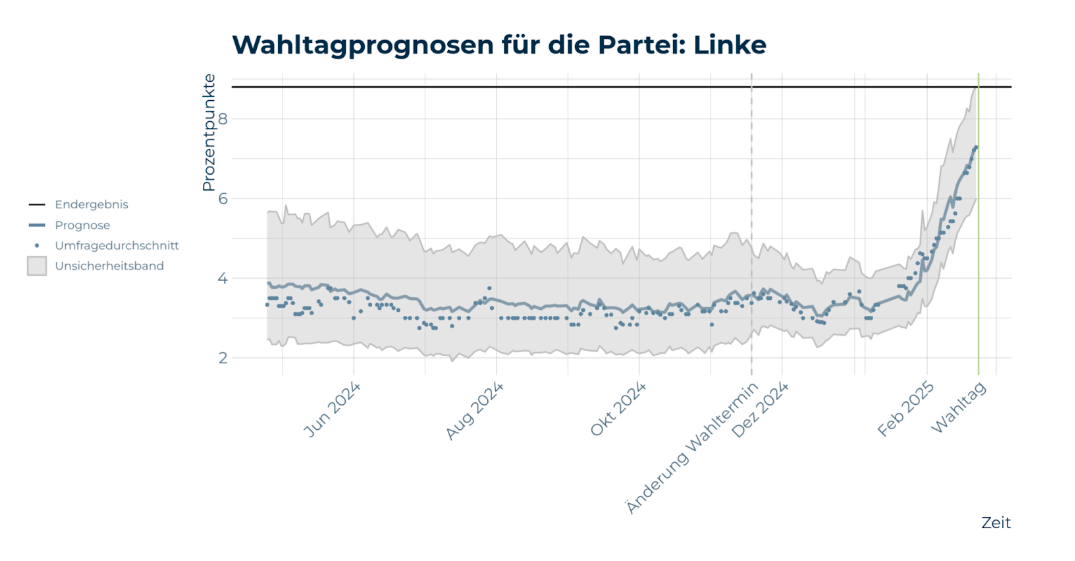
Figure 4: Forecast for the Left
The AfD's vote share was also underestimated, but less strongly, with an error of 2 to 3 percentage points in August 2024 (see Figure 5). The example of the AfD shows an advantage of our model, which assessed the AfD's vote share much more accurately at an early stage than a simple average of the polls. This can be explained by the fact that the model formulation anticipates that the effect of political events is often only short-term. In this case, the forecasts anticipate that the scandal surrounding the term "remigration" only cost the party votes in the short term. In fact, the effect of the scandal from the beginning of 2024 to the election largely evened out.
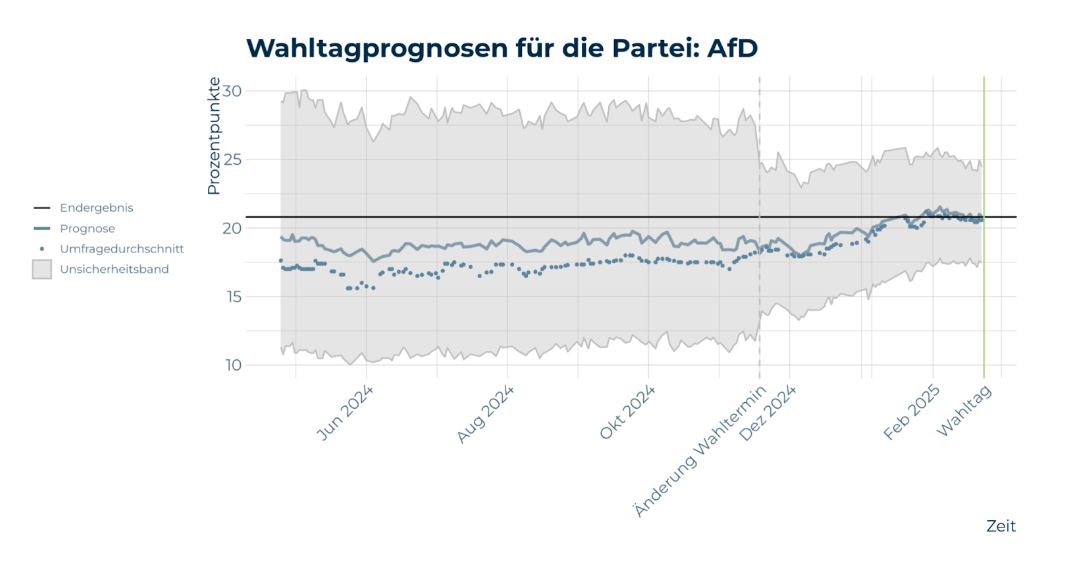
Figure 5: Forecast for the AfD
Nevertheless, it can be said overall that our model has under-forecasted the strengthening of the political extremes to this extent. It is also noticeable that the CDU/CSU's vote share was overestimated until the end. In the next section, we discuss how we can further improve our model.
Outlook
One idea for improving the coalition model is to adjust the modeling of the cooperation between multiple parties. This is motivated by the fact that we feel we predicted the probability for the "CDU-Greens-Left" coalition as being too high, given that there has not yet been a coalition between the CDU and the Left at the state or federal level. Additionally, the model could be adapted with regard to extreme events, so that the short-term surge of the Left Party before the election can be better represented. Last but not least, it would be good to evaluate why the CDU/CSU was mostly overestimated by us compared to the polling averages. Our model is fundamentally already capable of representing the party-specific biases of the polling institutes. However, this worked inadequately for the Union (CDU/CSU). It could be a point of adjustment to improve the model.
Summary
Striking about the election result is the strengthening of the political extremes. The vote share of the AfD and the Left has grown significantly compared to the last federal election. Our model predicted this well for the AfD, but underestimated it for the Left. An aggregated evaluation of our forecast for the vote shares of the parties shows that the model forecast has a similar accuracy compared to the pure polling average. Therefore, the added value of the model lies primarily in the calculation of uncertainties and event probabilities. The calculated probabilities of events, such as a majority of Black-Red (CDU/CSU-SPD), align with the occurrence or non-occurrence of the events at an evaluation cutoff of 50% probability. As a new feature, our coalition model is subsequent to the vote share model and deals with the exciting question of who will form the new government.
Additional Figures