Who will win the 2017 Bundestag election?
“But one of the reasons to build a model — perhaps the most important reason — is to measure uncertainty and to account for risk. If polling were perfect, you wouldn’t need to do this.“ Why FiveThirtyEight Gave Trump A Better Chance Than Almost Anyone Else Nate Silver auf FiveThirtyEight.com
Our 2017 Bundestag election forecast
[Last updated: September 22, 2017]
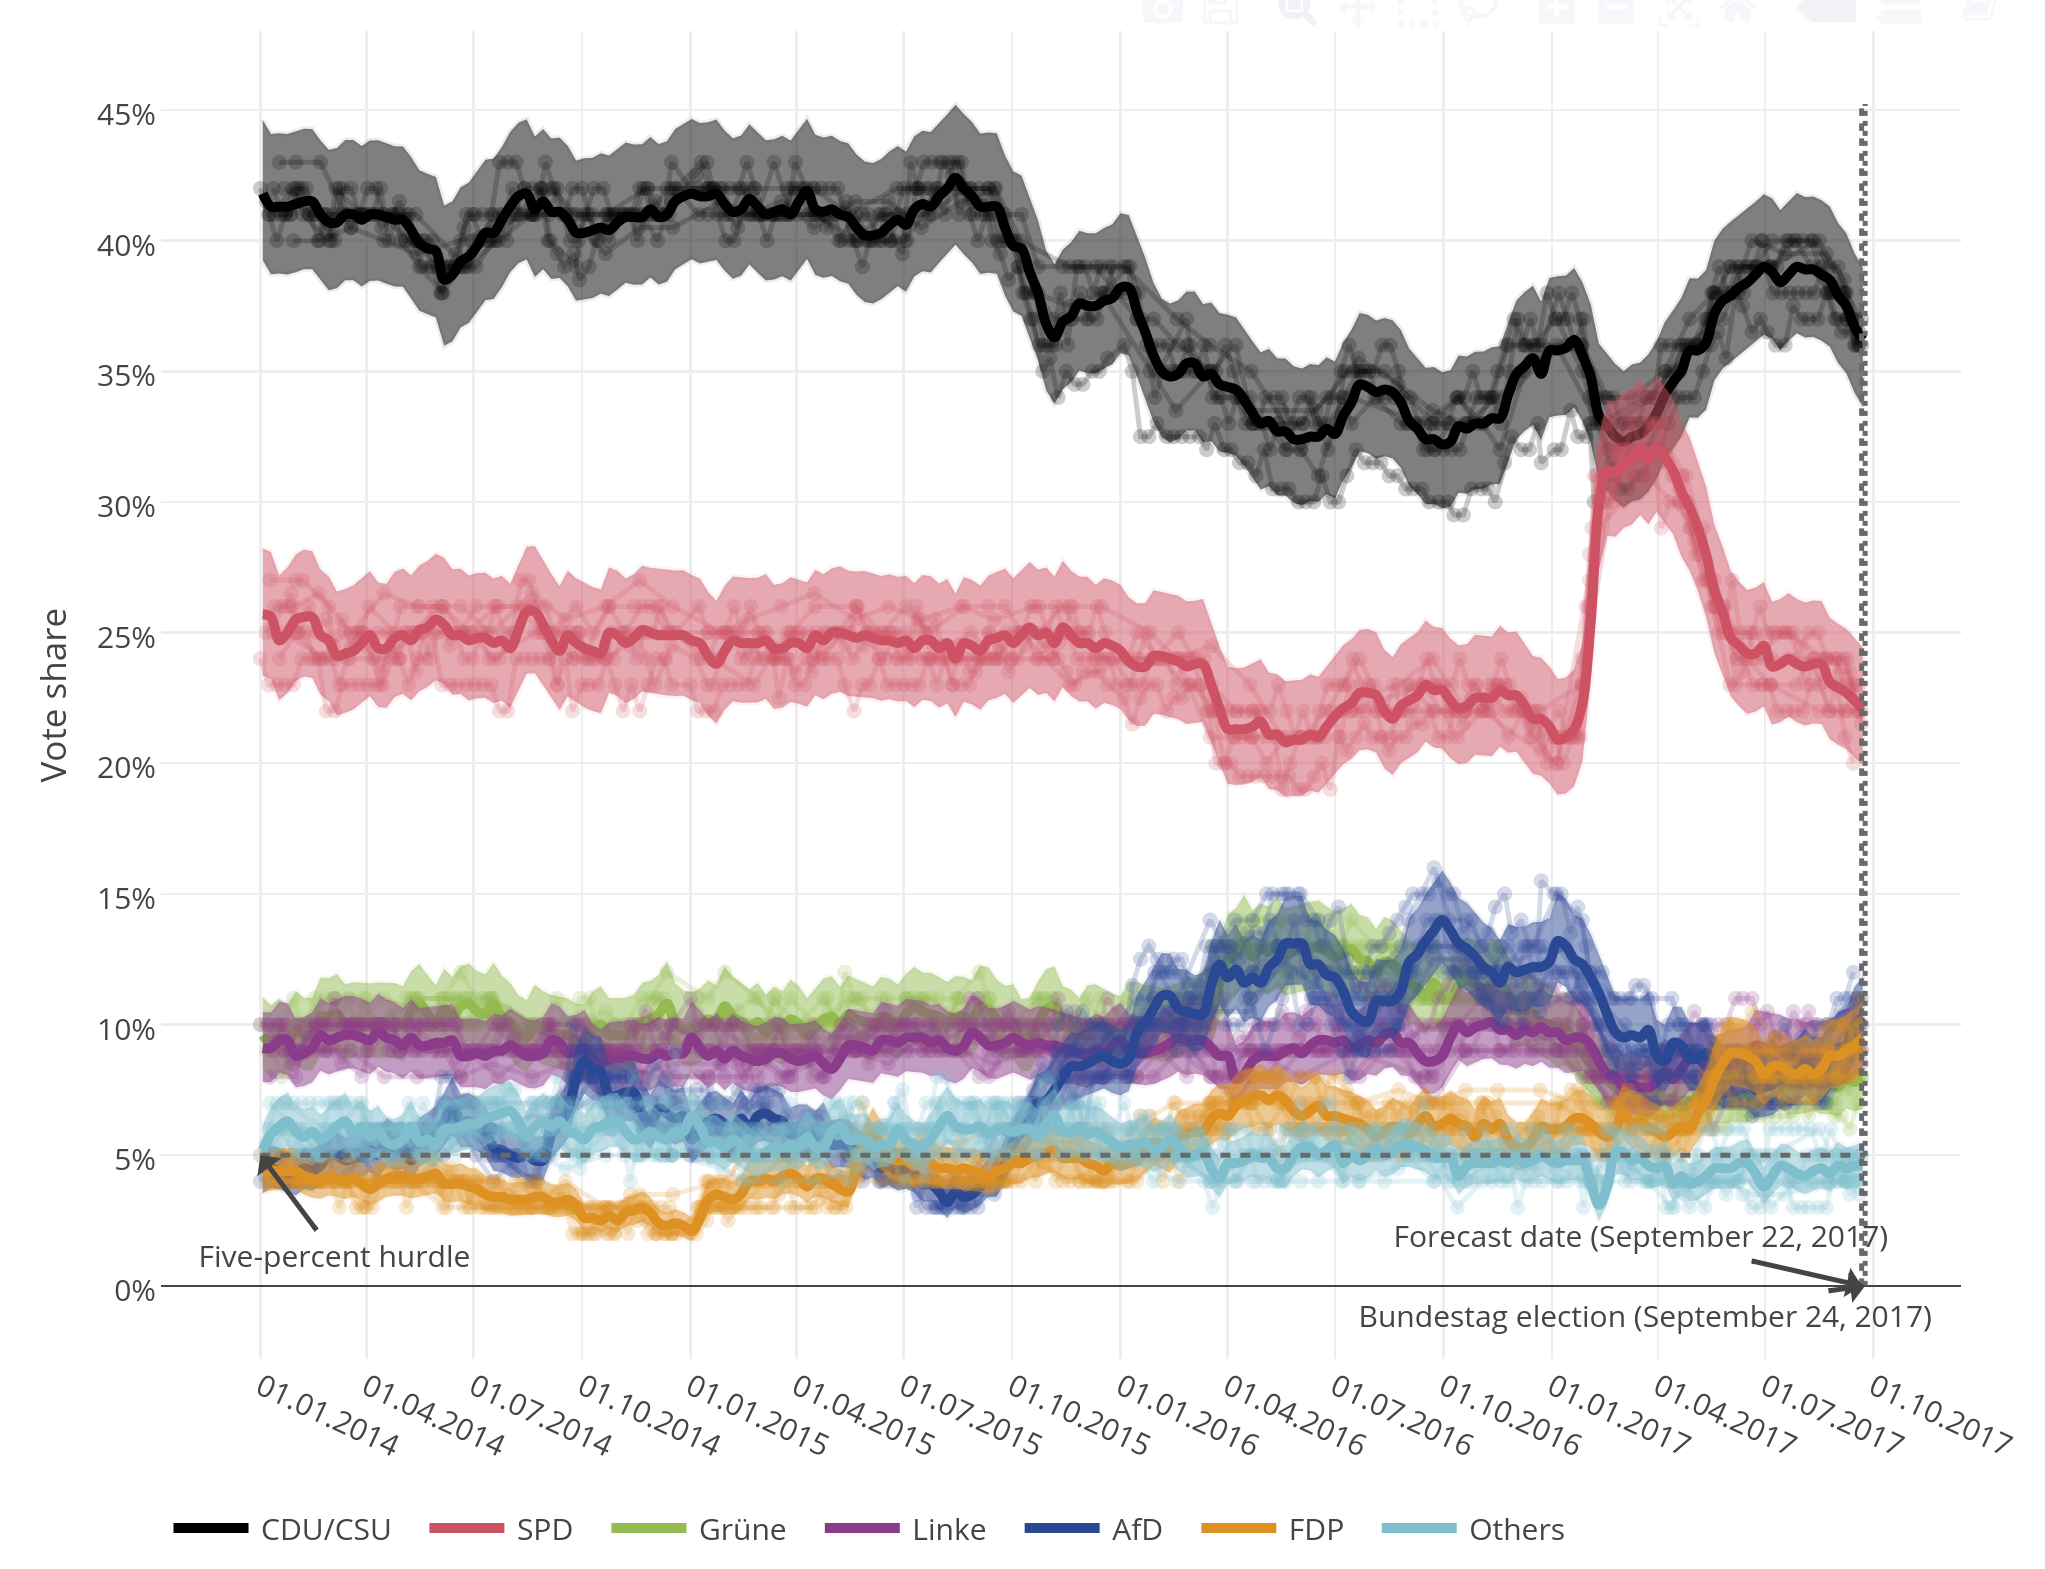 The graphic above shows INWT Statistics’ forecast for the 2017 elections to the Bundestag – Germany’s lower house of parliament. On the Y-axis, a thick line plots the predicted percentage of votes won by each party in an (imaginary) Bundestag election held on a date plotted on the X-axis. The shaded area around each line represents the 80 percent uncertainty range, meaning there is an 80 percent chance that the outcome will fall in this range. On the right side of the graph are two vertical lines. One shows the date on which our forecast was created, the other shows the date of the 2017 Bundestag election. The uncertainty intervals get wider the further into the future the prediction is made. There are also thinner lines in the background that display the forecasts from individual polling institutes.
Forecasting the election result: The probability distributions of possible outcomes of the 2017 Bundestag election
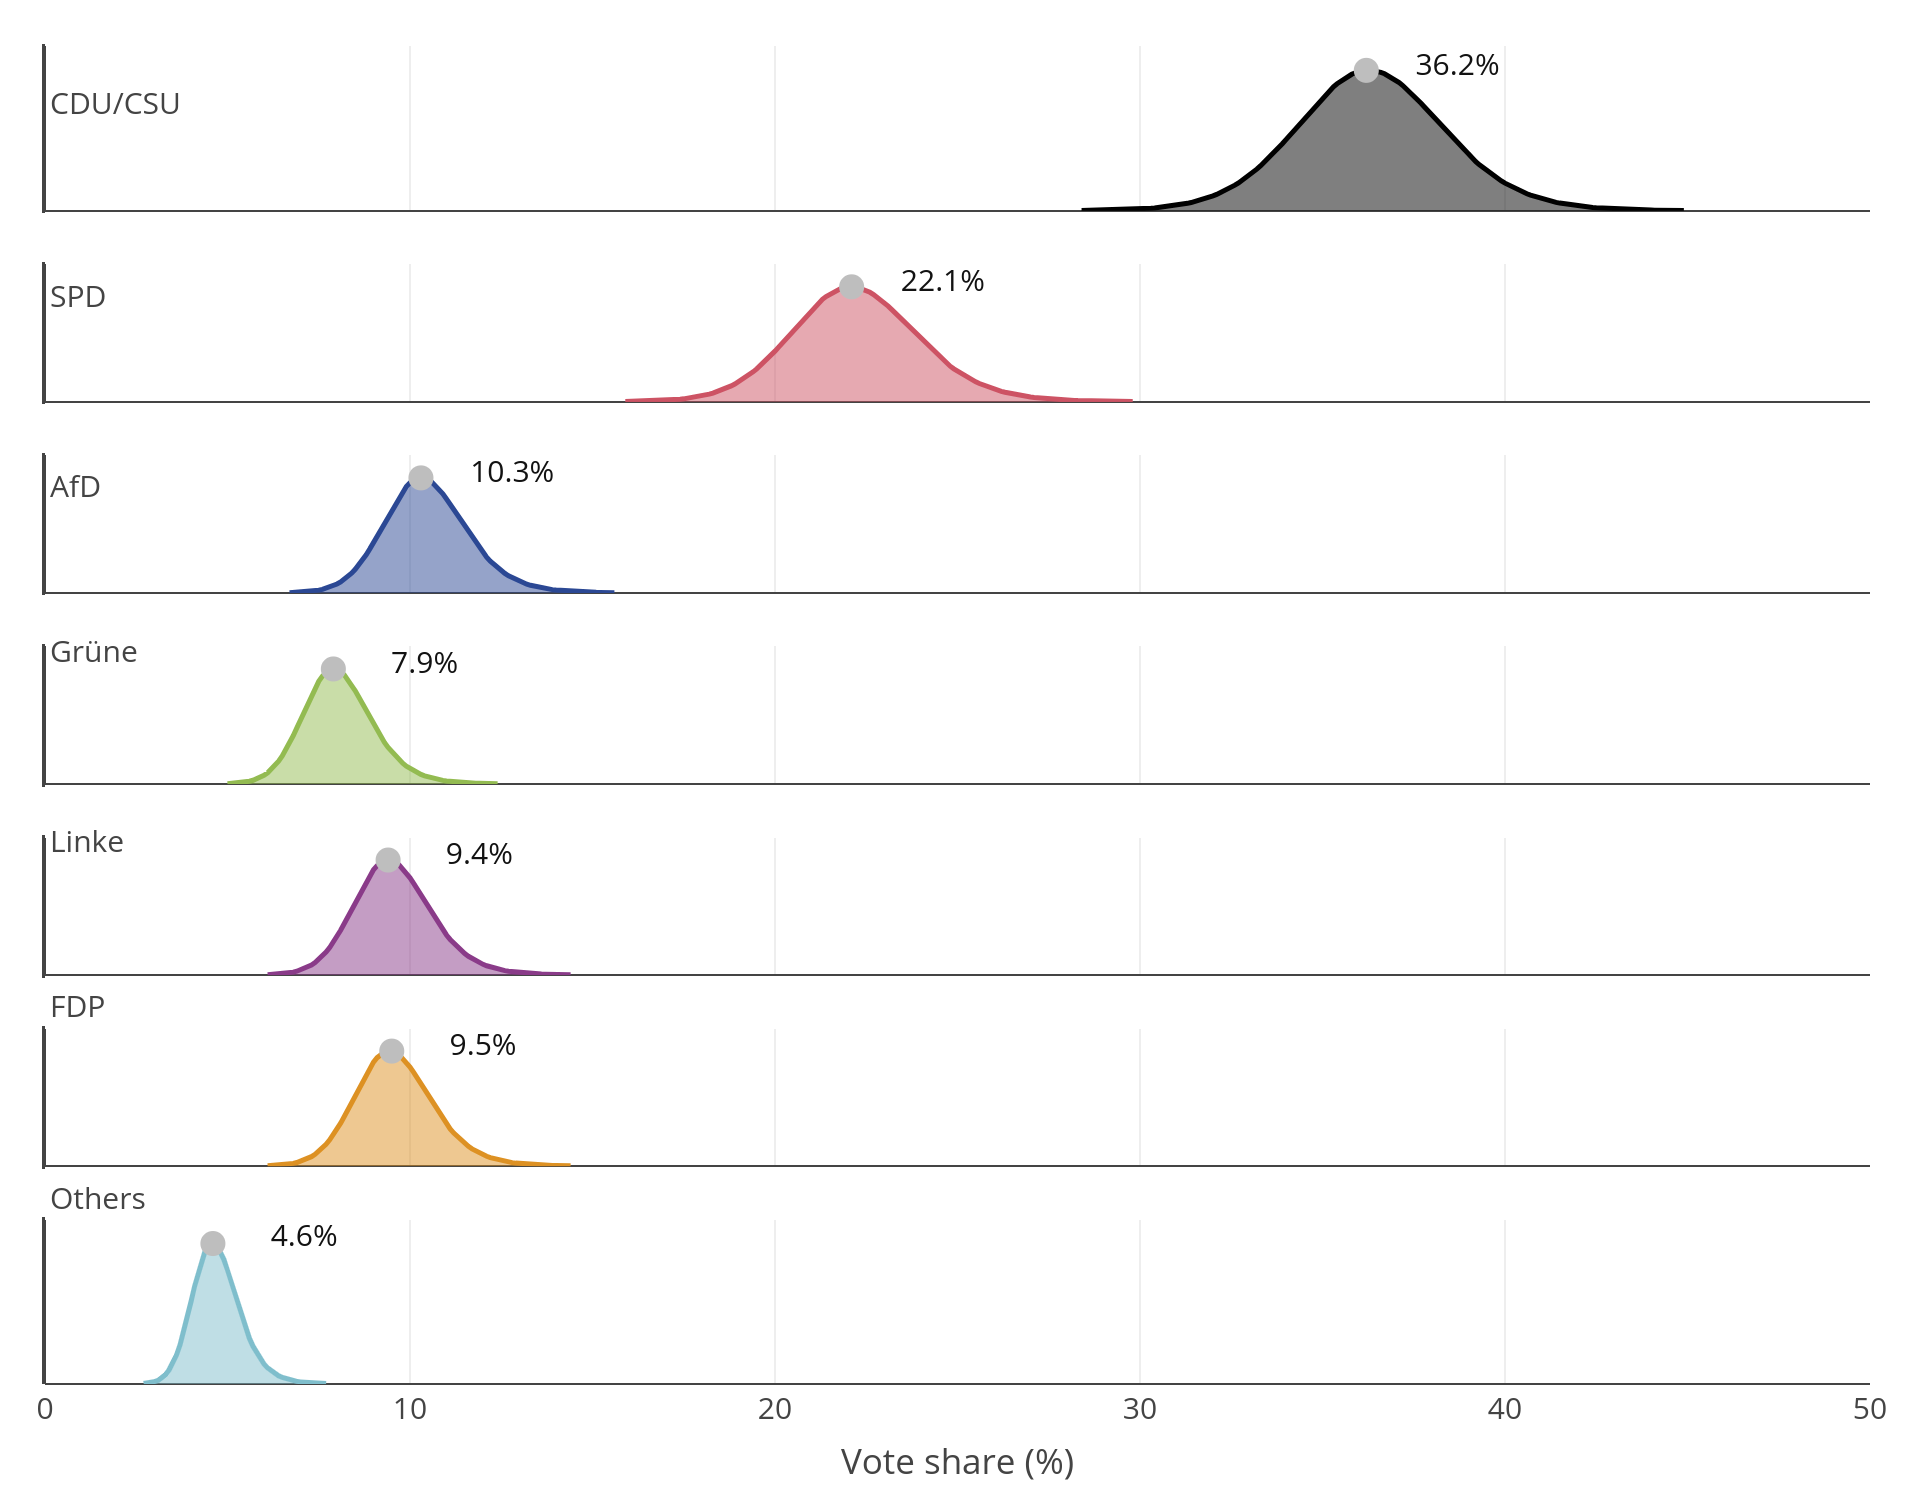
The following graphics show the so-called probability distributions of the possible outcomes of the 2017 Bundestag election as well as that of the current Sunday poll on party support. The most probable outcome – that is, our actual forecast for the result of the Bundestag election – is also shown. As there is still quite some time between the Bundestag election (September 24, 2017) and the current Sunday poll, the projected election result is characterized by a high level of uncertainty. The probability distributions show the complete distribution (100 percent). The data visualized in the graphics with 80 percent uncertainty limits are contained in the table.
2017 Bundestag Election
Sunday Poll

| Bundestag election September 24, 2017 | Sunday poll | |
|---|---|---|
| Party | Forecast | Lower limit |
| --- | --- | --- |
| CDU/CSU | 36.2 | 33.6 |
| SPD | 22.1 | 19.9 |
| AfD | 10.3 | 8.9 |
| Grüne | 7.9 | 6.8 |
| Linke | 9.4 | 8.1 |
| FDP | 9.5 | 8.2 |
| Others | 4.6 | 3.8 |
2017 Bundestag elections: The likely and less likely outcomes
We simulated the 2017 Bundestag election 100,000 times to determine the probability of various possible outcomes.
| Outcome | Probability |
|---|---|
| Majority for red-red-green | 0.0% |
| Majority for black-yellow | 9.4% |
| Majority for black-green | 5.3% |
| Majority for red-green | 0.0% |
| Majority for ‘Jamaica’ (black-green-yellow) | 99.8% |
| Majority for ‘traffic light’ (red-yellow-green) | 0.1% |
| Majority for grand coalition | 100% |
| FDP gets elected to the Bundestag | 100% |
| AfD gets elected to the Bundestag | 100% |
| CDU/CSU having more than 40 percent of the votes | 4.6% |
| SPD having more than 30 percent of the votes | 0.0% |
| SPD having less than 20 percent of the votes | 10.7% |
| SPD stronger than CDU/CSU | 0.0% |
| AfD becomes third strongest faction | 61.1% |
| Six factions will be represented in the Bundestag | 99.9% |
| Angela Merkel remains German chancellor* | 99.9% |
| Martin Schulz becomes German chancellor* | 0.1% |
*Detailed information can be found in our new blog article "Welche Koalition wird Deutschland nach der Bundestagswahl regieren?"
The “Sunday poll”: Who will be chancellor? Forecasting the outcome of the 2017 Bundestag election
Following the election drama witnessed in the US, we in Germany are now faced with the question of “Who’s it going to be?” – who will become federal chancellor on September 24, 2017? Unlike in the US, we in Germany “only” have access to forecasts from different polling institutes. These election forecasts have one major flaw: Their method operates under the assumption that the federal election is being held on the upcoming Sunday – a survey method known as the “Sonntagsfrage,” or “Sunday poll.” This means that the electoral researchers only get a good reflection of the political mood in Germany at that particular moment, and in no way make any kind of long-term forecast. We want to improve this system! As a data science and predictive analytics company, we specialize in producing qualified and extremely accurate predictions for our clients. We organize large volumes of data and analyze this data using statistical models. Our day-to-day work involves combining practical statistical expertise with well-established scientific methods. Our models can’t foresee the future, but we can determine the likelihood of all possible election outcomes by evaluating the data we have at hand.
BTW17: Our statistical forecasting model for the 2017 Bundestag election
We used Nate Silver’s blog FiveThirtyEight.com as the template for our project BTW17, which provides a statistical model for the 2017 Bundestag election. Our forecast model is based on opinion polls carried out by various institutes and allows both short-term and long-term predictions to be made about the probability of all possible election outcomes. Using this model, we are able to deduce, for example, the likelihood of a Bundestag majority being held by the much-discussed red-red-green coalition (R2G), or how likely coalitions other than the grand coalition (GroKo) of CDU/CSU and SPD are – such as the traffic light or Jamaica coalitions (both of which include the FDP). What also sets our forecasts apart is that, rather than simply predicting the percentage of votes each individual party will receive, we focus on modeling forecast errors. A forecast error is the difference between the predicted election result and the actual result. This includes both over- and under-forecasting. Modeling forecast errors in this way allows us to supplement our election forecasts with a realistic uncertainty interval.
Data science and predictive analytics in the election campaign: Forecasting results using statistical models
Compared to absolute statements such as “The SPD will receive 27 percent of the votes,” the statements provided by the probability distributions displayed above may seem unsatisfying at first glance. But the reason we talk about “probability” and “uncertainty” is that the actual result can’t be predicted 100 percent accurately. A forecast can never – and should never – claim to be prophetic. Forecasts make statements about future conditions, and are therefore invariably coupled with uncertainty. This uncertainty arises partly because the underlying scientific methods can rarely be implemented perfectly. Polls, for example, are skewed because of the overrepresentation of certain voter groups in election surveys. Uncertainty also stems from the fact that we simply don’t have enough information to accurately predict the future. This was most recently witnessed in the US presidential election in November 2016, when polls showed Hillary Clinton way ahead in the race, with some institutes even giving her a 98 to 99 percent chance of becoming the superpower’s first female president . As it turned out, the election went the other way. But there were some slightly more realistic election forecasts.
Forecasting the US election: A statistical model predicts who will become US president
There was one person who did not count Trump out of the race: US election researcher and statistician Nate Silver delivered, statistically speaking, the most precise forecast. In his US presidential election forecast, Silver stated shortly before the election that Donald Trump had a 22 to 34 percent chance of winning. That means that in 100 elections with similar conditions, Trump would have emerged president in 22 to 34 cases. Not exactly insignificant, right? Shortly before the presidential election, Nate Silver tweeted that the following three scenarios were more or less equally likely: 1) A solid win for Hillary Clinton, 2) An epic Clinton blowout, and 3) A close call with Trump probably coming out on top. At this same point in time, most of the US media and opinion researchers were still assuming that Clinton’s move into the White House was a sure thing. So where did Nate Silver get his information from and who actually is he? Nathaniel Read “Nate” Silver is a columnist and statistician. He first found himself in the public eye after as the developer of PECOTA: an algorithm for predicting the performance and career path of professional baseball players. In 2008, Nate Silver founded the well-known blog FiveThirtyEight.com, which debuted a whole new method of election forecasting – taking the historical election forecasts of (almost) all existing polling institutes as well as demographic data, he developed a statistical model that could be used to predict, among other things, the outcome of the US presidential elections. In practice, Silver’s model has proved astonishingly accurate on several occasions.
The most likely election result in 2017: How to understand election forecasts
Unfortunately, forecasts are often misunderstood. Like every prediction, an election forecast is a statement of probability and not a set-in-stone prophecy. This was clear with the US election and Trump’s largely unexpected victory. This means that:
- A very unlikely event can still occur
- A very likely event will not inevitably occur
This situation is illustrated in the following extract from a blog article by Übermedien:
“If, when reading about the election, it’s reported that Hillary Clinton has an 83 percent chance of becoming president of the United States, would you then be able to sleep easy, safe in the knowledge that Donald Trump doesn’t stand a chance?
Let me ask another question: If someone were to put a revolver in your hand and ask you to play Russian roulette, would you play? Or would the risk of hitting a loaded chamber seem too great? We all know how dangerous this game would be: You’d only have an 83 percent chance of winning.”
Das Schlechteste an Wahlprognosen: Wie wir mit ihnen umgehen
(The worst thing about election forecasts: How to understand them)
Stefan Niggemeier, November 13, 2016
Red-red-green; traffic light; Jamaica; another grand coalition? Not even we can predict the outcome of the 2017 election and the ultimate governing coalition. But we are professional statisticians and draw conclusions regarding probability on the basis of the information we have at hand. Because our forecast is based on survey results from individual polling institutes, the quality of our forecast model is, by implication, dependent on the general quality of these surveys. Should it be the case, for example, that all the institutes’ election surveys overestimate the percentage of votes received by a particular party, out model will also tend to overestimate this party. With our approach, however, this scenario should be covered by our model’s margins of error.
The quality of the 2017 Bundestag election forecasts
Publishing a realistic margin of error is essential for assessing the validity and quality of any forecast for the 2017 Bundestag election results. We specify an 80 percent confidence interval for our forecasts. This means that we expect the actual election results to be within this range in 8 out of 10 cases. The electoral research institutes are generally very cautious about publishing confidence intervals and margins of error with their predictions of election results. This is mainly because firm interpretations are preferred, as these attract more media attention. Both the news media and readers/viewers prefer accurate predictions and are put off by “complicated confidence intervals.” Since poll respondents are not chosen randomly from the whole population, the confidence interval is actually not that easy to calculate. The Forschungsgruppe Wahlen polling institute conducts landline telephone polls and then weights these samples by gender, age and education (see the Forschungsgruppe Wahlen’s methodology [German]) to make them representative. For 1,250 respondents, the researchers specify a 95 percent confidence interval with a +/- 3 or +/- 2 percent margin of error for parties with a 40 or 10 percent predicted share of the vote. These margins of error have been calculated using a formula suitable for a weighted random sample. However, the fact that it’s impossible to weight all the characteristics affecting people’s choices is a problem. Other circumstances may also increase the level of inaccuracy. For instance, respondents may not answer truthfully about certain parties, or there may be uncertainty about whether they will vote at all. Some correction factors can be used here (this procedure is often very unclear) to reduce the resulting distortions. In INWT’s view, it’s therefore better to determine margins of error retrospectively. This means using the variation between the forecasts for past elections and the actual election results. According to our calculations, the margins of error for one institute’s Sunday poll are slightly high, at +/- 4 percentage points for a 40 percent share and +/- 2.5 percentage points for a 10 percent share of the projected vote. Based on retrospective margins of error, we were also able to specify margins of error for the upcoming Bundestag election in 2017.
Our statistical model for forecasting the 2017 Bundestag election results
The statistical modeling for the 2017 Bundestag election forecast is done in four key steps:
Step 1: Historical polls and the actual results of the last Bundestag elections determine the predictive accuracy of each polling institute. For instance, the Allensbach Institute polls are 12 percent more accurate on average than polls by Emnid. This takes into account how long before the election each institute published their last forecast, and corrects the result accordingly. Each polling institute receives a weighting factor according to their historical forecast accuracy. So opinion polling institutes that produce polls with a good forecast accuracy have a greater impact on the modeling than electoral research institutes that perform less well.
Step 2: The current poll results for the 2017 Bundestag election are combined into an overall trend. The quality and any possible party preference of the polling institute are taken into account in this process. The party preference of an institute is the systematic over- or underestimation of the election results of certain parties. For example, the pollsters at INSA are consistently 3-4 percentage points below other electoral research institutes in their estimates of the CDU/CSU results. In addition, the long- and short-term trends are used to create the best forecast for the upcoming election. Major news events (such as party scandals) that occur long before the 2017 Bundestag election have a limited impact on the election results. In the short term, however, it is beneficial to extrapolate from current trends (whether positive or negative).
Step 3: An uncertainty interval for the result of each party is calculated by looking at the historical results of previous elections. We project this interval onto the predicted results, taking into account the time left until the next Bundestag election, and noting the error correlations between the parties. If, for example, the CDU/CSU does worse than predicted by the researchers on election night, the FDP will usually get more votes than expected.
Step 4: : Some 100,000 election results are simulated to determine the probabilities of possible compositions of the Bundestag. In doing this, we take into account special features of German electoral law such as the five-percent hurdle.
Poll results serve as the data source for election forecasts
The model for the 2017 Bundestag election forecast is based on data from historical poll results from every Bundestag election from 1998 to today. These are taken from the following prestigious polling organizations: Allensbach, Emnid, Forsa, Forschungsgruppe Wahlen, GMS, Infratest Dimap, and INSA. The poll results of these institutes for the 2017 Bundestag election are publicly accessible to everyone at http://www.wahlrecht.de/umfragen/ [German]. We’d like to take this opportunity to thank Wilko Zicht and Matthias Cantow for compiling the data.
How reliable is our 2017 Bundestag election forecast?
It's perfectly legitimate to ask about the reliability of our 2017 Bundestag election forecast. We retrospectively tested our model on the most recent Bundestag elections. To measure the quality of our forecast model, we used the mean deviation of our results forecasts from the actual election results. For various forecast horizons and all parties, our model was 11 percent more accurate than the average of the last five forecasts by polling institutes, and even 13 percent more accurate than the last available forecast by one randomly selected polling institute.
Forecasts three months before Bundestag election 2013 (June 24, 2013)
| CDU/CSU | SPD | Linke | Grüne | FDP | AfD | |
|---|---|---|---|---|---|---|
| Bundestag election 2013 | 41.5% | 25.7% | 8.6% | 8.4% | 4.8% | 4.7% |
| INWT forecast | 38.9% | 26.4% | 7.5% | 13.4% | 5.3% | 2.4% |
| Mean of the last 5 institute forecasts | 39.8% | 24.8% | 7.4% | 14.6% | 5.0% | 2.2% |
| Last institute forecast (INSA) | 39.0% | 26.0% | 7.0% | 16.0% | 4.0% | 2.0% |
Based on the mean of the absolute deviations, we calculated mean deviations or forecast errors of 2.03 percent (INWT forecast), 2.13 percent (average of the last five election polls), and 2.58 percent (last available forecast). If we pit these values against one another, the INWT forecast was 5 percent (the average of the last five election polls) or 21 percent (the last available forecast) better than the other forecasts in comparative terms.
As an example, the INWT forecast error is calculated as follows:
(|38.9-41.5|+|26.4-25.7|+|7.5-8.6|+|13.4-8.4|+|5.3-4.8|+|2.4-4.7|)/6 = 2.03 %
Links
INWT German Federal Election Forecast 2021: Who will win the election?