Predictive LLMs: The Role of Multimodal Data in Price Forecasting
In our last post, we documented how Large Language Models (LLMs) can handle regression tasks, such as predicting used car prices, through targeted fine-tuning. We were able to show that combining tabular features with free-text descriptions significantly increases forecasting accuracy. Nevertheless, an important factor remained unconsidered: the visual impression of the vehicle.
A potential buyer rarely evaluates a car solely on the basis of mileage and equipment features; the decision is also based on appearance. In this article, we therefore investigate the next feature extension: To what extent does the integration of images within a multimodal architecture improve the accuracy of price estimation?
The Methodological Approach: Text, Tables, and Images as Combined Features
In our current experimental setup, we first integrated the vehicle images directly into the training process. The challenge is to create an architecture that efficiently links both structured data (year of manufacture, mileage) and unstructured information (description texts and photos). The goal is for the model to learn to incorporate the overall visual impression as well as visual details — such as the condition of the paint, the appearance of the rims, or even visual cues of potential damage to the car — into the economic evaluation.
Technically, such multimodal processing can be implemented today via interfaces like the OpenAI API. This makes it possible to transmit text prompts and image data simultaneously to the model to generate a holistic response. To allow the images to be transmitted via the API, they are "base64" encoded beforehand. In this encoding process, the image file is translated into a text sequence of ASCII characters, enabling reliable transmission within standardized JSON requests.
For fine-tuning with images, we use the OpenAI model "gpt-4o-2024-08-06". This is a variant of gpt-4o - it is recommended in the documentation for this purpose.
To measure the value added by the image data, we compared different scenarios. TabPFN, a foundation model specifically optimized for tabular data, serves as the baseline.
Comparison of Results
Table 1 compares the performance metrics for different model configurations. We consider the Median Absolute Percentage Error (MAPE), the Median Absolute Error (MAE), and the R2 calculated on test data to obtain a realistic picture of the deviation. The forecasts after fine-tuning GPT-4o are compared with TabPFN forecasts.
The results for GPT-4o are based on a training dataset for fine-tuning consisting of 360 observations, while approximately 1,400 training observations are taken into account for the TabPFN forecast. Fine-tuning including images via the OpenAI API costs about $12.
| Modell | Median Absolute Error (MAE) | Median Absolute Percentage Error (MAPE) | R² Score |
|---|---|---|---|
| GPT-4o (Images + Description + Tabular) | 700 € | 16.76 % | 0.90 |
| GPT-4o (Description + Tabular) | 801 € | 17.92 % | 0.89 |
| TabPFN (Tabular mit Bild-Score Feature) | 1054 € | 21.88 % | 0.85 |
| TabPFN (only Tabular) | 1081 € | 22.03 % | 0.84 |
| GPT-4o (only Images) | 1400 € | 33.33 % | 0.73 |
Table 1: Forecast metrics with different models on the same test dataset.
Summary of Results
The metrics enable a comparison of model performance:
- Information content of image data: The addition of images causes a reduction in the median of absolute errors by €101. This confirms the assumption that images contain information that is explicitly mentioned neither in the tabular equipment features nor in the text description. In particular, the tabular features contained no consistent information regarding external characteristics such as paint condition.
- Value of unstructured data accessible through LLMs: While TabPFN shows solid performance on metric and categorical data, the jump to LLM-based models illustrates the value of unstructured data. Even the LLM's ability to "understand" the text of the vehicle description leads to a significantly more precise estimate (cf. result "GPT-4o (Tabular + Description)" vs. TabPFN).
- Potential with images alone: Even if the forecasts generated solely on the basis of images cannot keep up with the other results, an R2 of 0.73 is still a result with which the forecast can add value when a price assessment is to be made. This demonstrates the potential of multimodal models to also generate forecasts when only images are available in the dataset.
Cross-Validation and Explainability of Results
To ensure generalizability, it is standard practice to perform cross-validation on smaller datasets. This prevents the result from depending on the choice of the test-train split.
However, multiple fine-tuning sessions with images would generate substantial costs and is less convenient due to the waiting times during fine-tuning. Therefore, we chose a different path and generated a feature from the images that rates the appearance of the vehicle on a scale of 1–10. In a cross-validation with TabPFN, it becomes evident that this feature adds significant value. On 25 out of 30 splits, the MAE decreases due to the feature. On average across the splits, the MAE is reduced by €58, although in the case of the split in Table 1, it is only by €27.
From this, we conclude that the observed advantage of fine-tuning with GPT-4o including images (Table 1) is also generalizable to data from the same distribution.
When looking at individual images, it can be seen that, for example, a car with accident damage receives a particularly low score, whereas a car with gull-wing doors and very high-quality paint receives a very high score.
Figure 1 also shows the individual forecast errors per decile of true prices in the test set for the model version with images, which generated the best overall metrics in Table 1. In the top decile of prices, a tendency toward underestimation can be seen.
At the same time, our analysis reveals that the images led to a stronger improvement in the top decile than overall. For instance, Figure 2 shows that the MAE decreases the most in the top decile when comparing "with image" vs. "without image." We also observe that in this range, corrections were mostly made upward if the forecast was improved. The tendency to underestimate in the top decile is thus somewhat counteracted.
Consequently, for higher-priced cars, an image enables an improvement in the forecast if, for example, the paint looks particularly good and the price would have been underestimated without images. For low-priced cars, on the other hand, it is not as clear-cut.
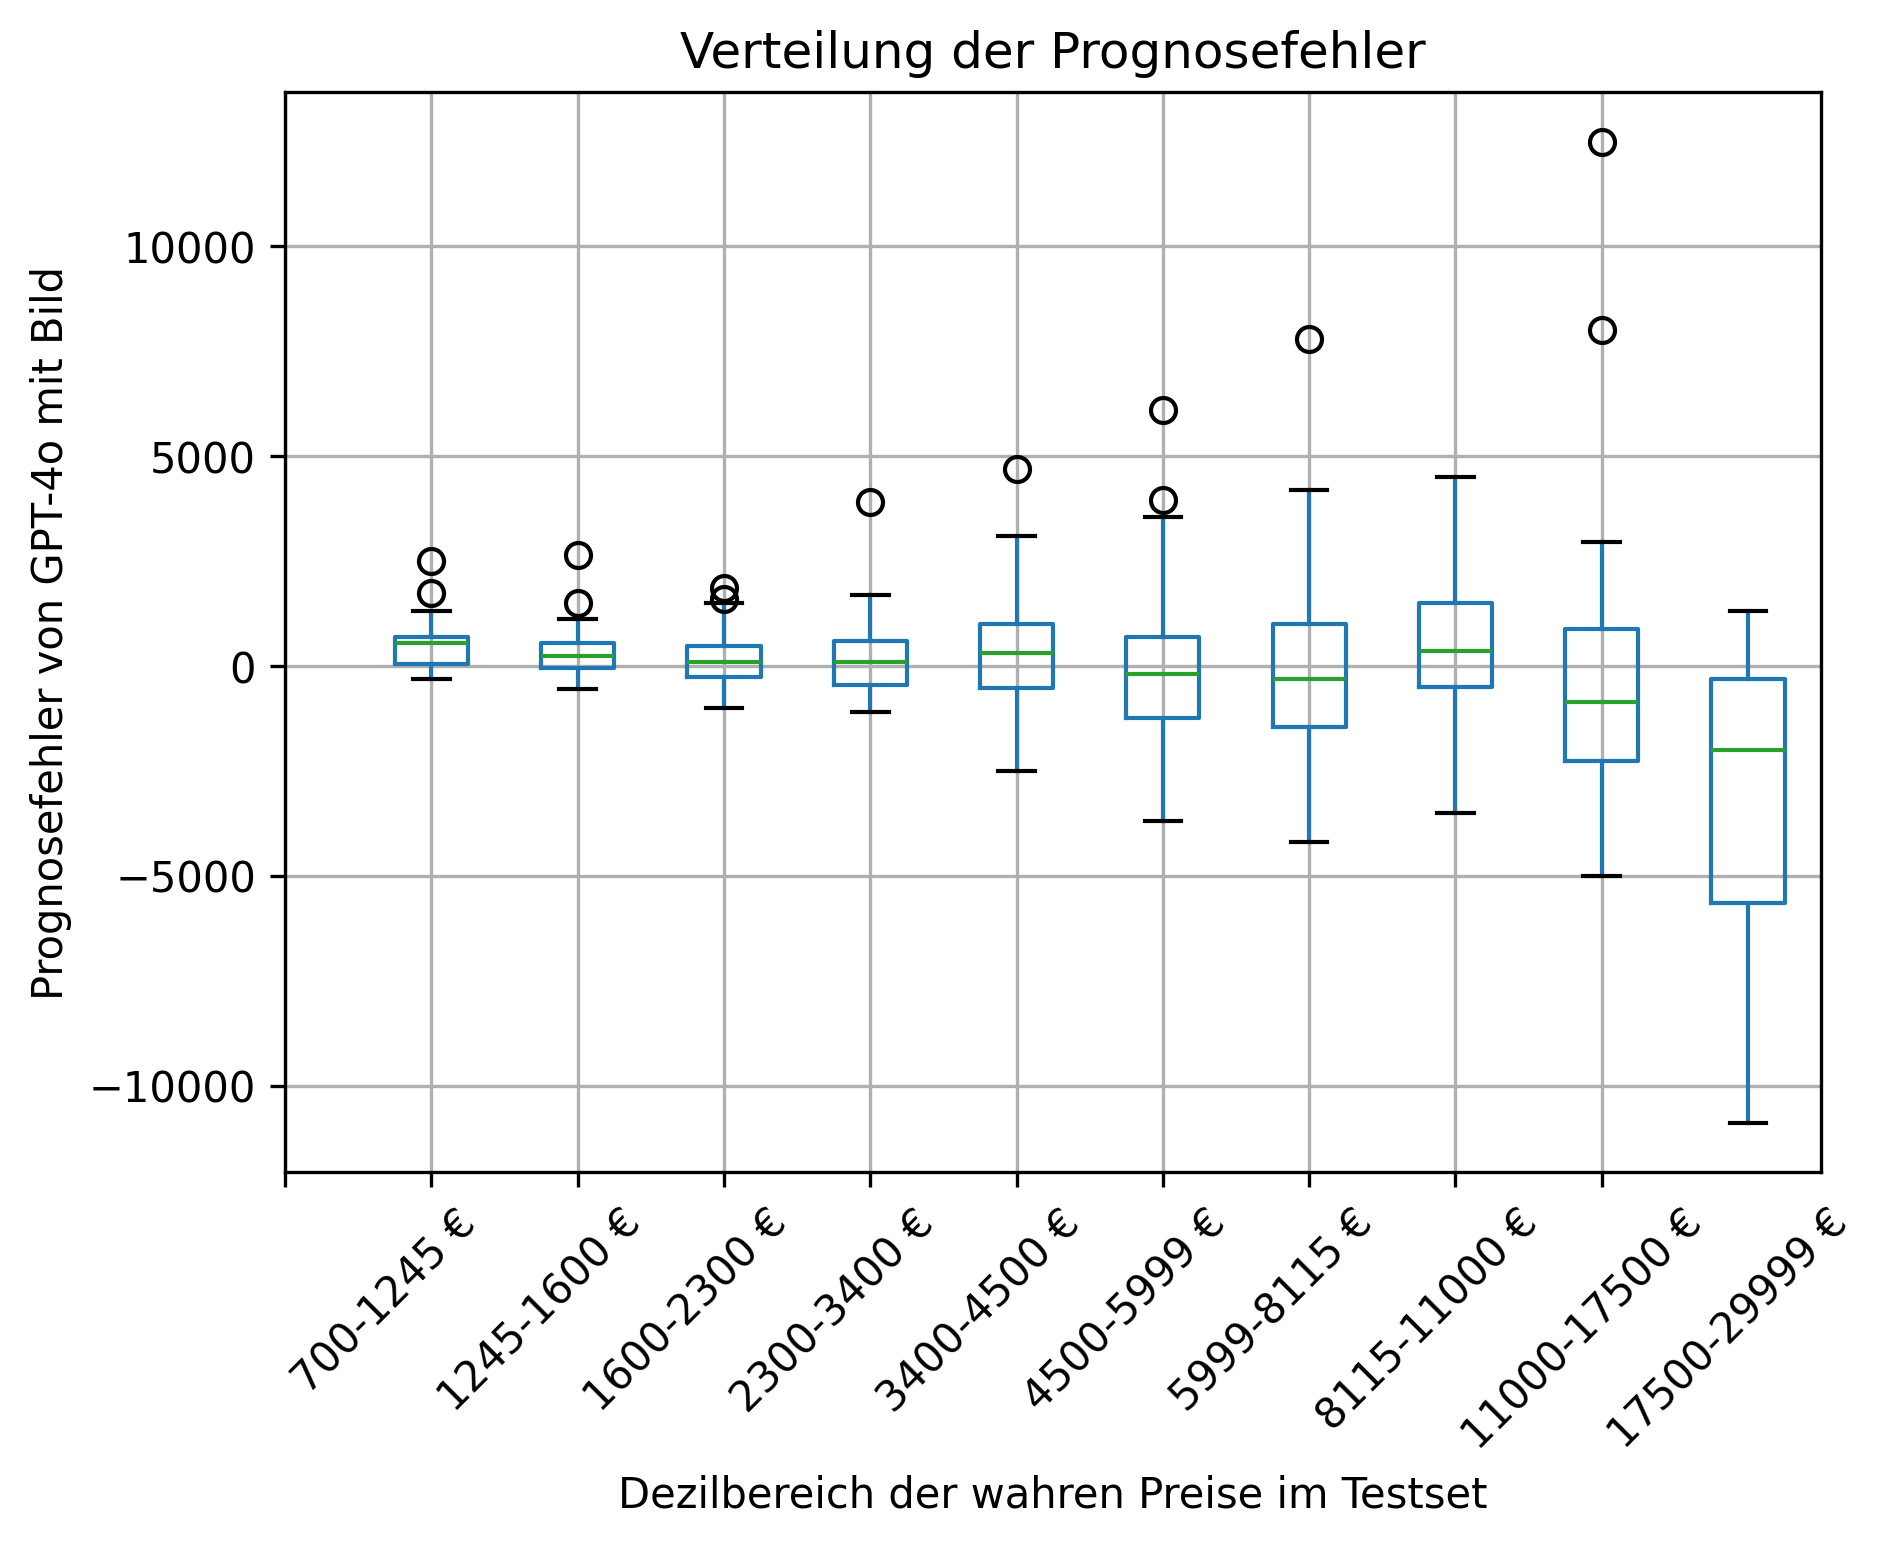 Figure 1: Prediction errors by decile of true values in the test set. Forecasting model: GPT-4o (Images + Description + Tabular features).
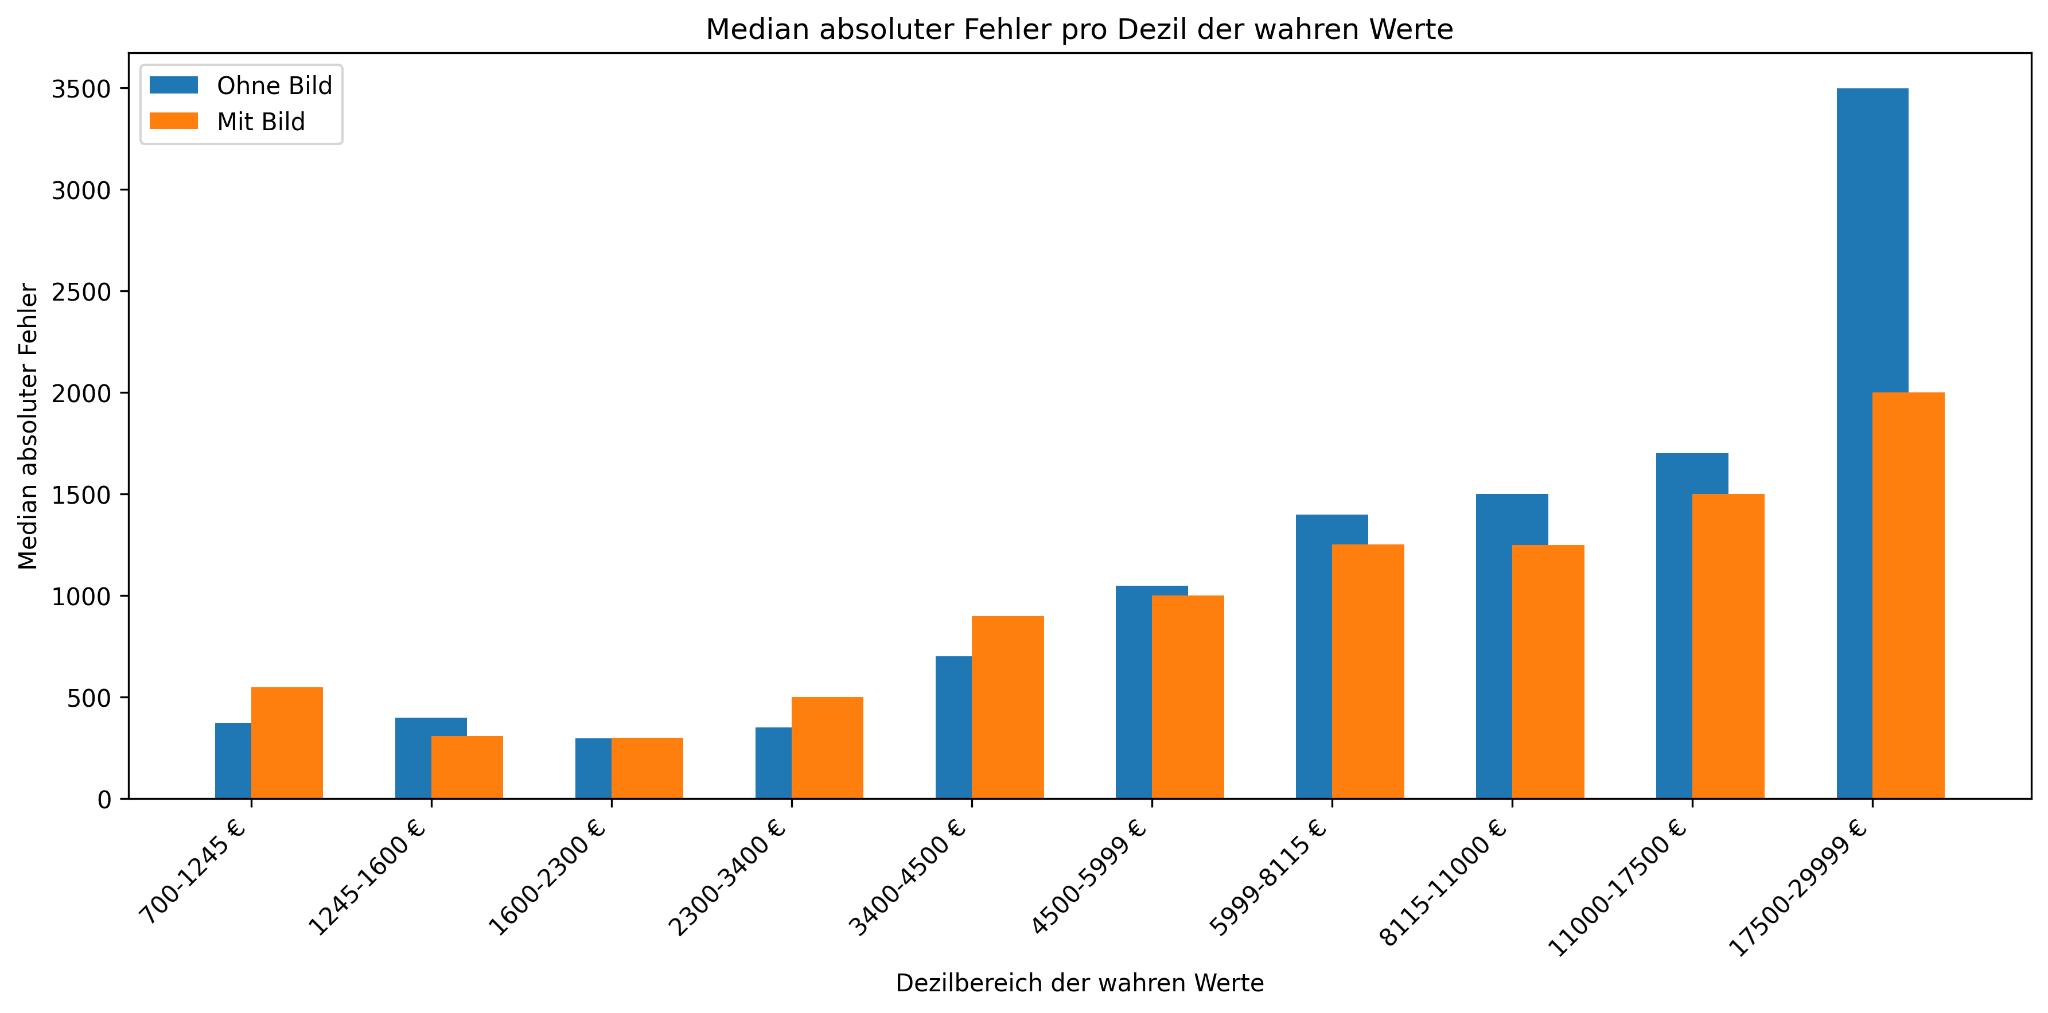 Figure 2: Median absolute error by decile of true values in the test set. Compared is GPT-4o with images + description + tabular features vs. GPT-4o with description + tabular features.
Discussion and Outlook
Images are an additional source of information that can be used as a feature. This raises the question of interpretability. Can we, for example, visualize which areas of an image the model uses for price determination? Using image and text simultaneously in a prompt makes this task more difficult.
A promising option is to generate tabular features in advance, per image and without fine-tuning. In our case, cross-validation with TabPFN showed that the images offer added value through the score feature for visual evaluation.
This has the slight disadvantage that we must already know or suspect which aspects of the image are particularly valuable to the model for the forecast. Furthermore, the quality of the forecasts is significantly better when LLM fine-tuning is applied.
However, the advantage of feature generation lies in an improved traceability of the LLM results: The plausibility of the LLM evaluation can thus be checked at least on a sample basis per image.
Our test shows that fine-tuning should be used for optimal forecasting accuracy. In contrast, feature generation and its use in TabPFN allows for improved traceability of the image results while simultaneously permitting a more comprehensive cross-validation.
In summary, the integration of image-based features is an important step toward a more realistic price forecast. For practical applications, this means that the quality of image data is becoming a factor not only for human perception but increasingly also for algorithmic evaluation.