Introducing the kafka R Package
Apache Kafka is renowned for its ability to handle large-scale, real-time data streams. Even simple clusters can process throughputs of huge amounts of messages. Kafka stores them on multiple replicas to minimize the likelihood of data loss. Despite Kafka's widespread use across industries, we encountered a notable gap for some of our projects: while Kafka easily integrates with Python, there was no equivalent solution for R. This changes with the development of the kafka package. Let's walk through a practical example to demonstrate how kafka works!
Hands-on with kafka: Traveling with the ISS
We set up our own cluster in advance. To reproduce these steps, take a look at our README. You can install the latest version of our R package from GitHub by running
remotes::install_github("inwtlab/r-kafka")
Producing ISS Positions
library(httr)
library(jsonlite)
library(kafka)


config <- list(
  "bootstrap.servers" = "localhost:9093"
)
producer <- Producer$new(config)

while (TRUE) {
  response <- GET("http://api.open-notify.org/iss-now.json")
  json_content <- content(response, as = "parsed", encoding = "UTF-8")
  json_string <- toJSON(json_content, auto_unbox = TRUE)
    producer$produce("iss", json_string)
  Sys.sleep(3)
}
Initially we define the configuration to connect to our cluster and create a Producer class. We retrieve real-time ISS (International Space Station) location data, which is pulled from an open source API and updated frequently (roughly every three seconds). The data is first decoded and then formatted in JSON before it is written to the Kafka topic. This process iterates every three seconds. Of course, Kafka can handle much larger amounts of data than we show in our example.
Consuming ISS Positions
library(shiny)
library(leaflet)
library(jsonlite)
library(kafka)

ui <- fluidPage(
    leafletOutput("iss_map", height = "80vh")
)

server <- function(input, output, session) {
    consumer <- Consumer$new(list(
        "bootstrap.servers" = "localhost:9093",
        "group.id" = paste(sample(letters, 10), collapse = ""),
        "enable.auto.commit" = "True"
    ))

    consumer$subscribe("iss")

    iss_position <- reactive({
        on.exit(invalidateLater(0))
        message <- result_message(consumer$consume(5000))
        if (!is.null(message$value)) {
            data <- fromJSON(message$value)
            list(
                latitude = as.numeric(data$iss_position$latitude),
                longitude = as.numeric(data$iss_position$longitude)
            )
        }
    })

    output$iss_map <- renderLeaflet({
        leaflet(options = leafletOptions(zoomSnap = 0.1, zoomDelta = 0.1)) %>%
            addProviderTiles(providers$Esri.WorldImagery) %>%
            setView(lng = 0, lat = 0, zoom = 2.3)
    })

    observe({
        if (is.null(iss_position())) {
            return()
        }

        leafletProxy("iss_map") %>%
            clearMarkers() %>%
            addMarkers(
                lng = iss_position()$longitude,
                lat = iss_position()$latitude,
                icon = makeIcon(
                    iconUrl = "https://img.icons8.com/?size=100&id=7ThZQJ5wZJ2T&format=png&color=000000",
                    iconWidth = 30, iconHeight = 30
                )
            )
    })

    session$onSessionEnded(function() {
        consumer$close()
    })
}

shinyApp(ui = ui, server = server)
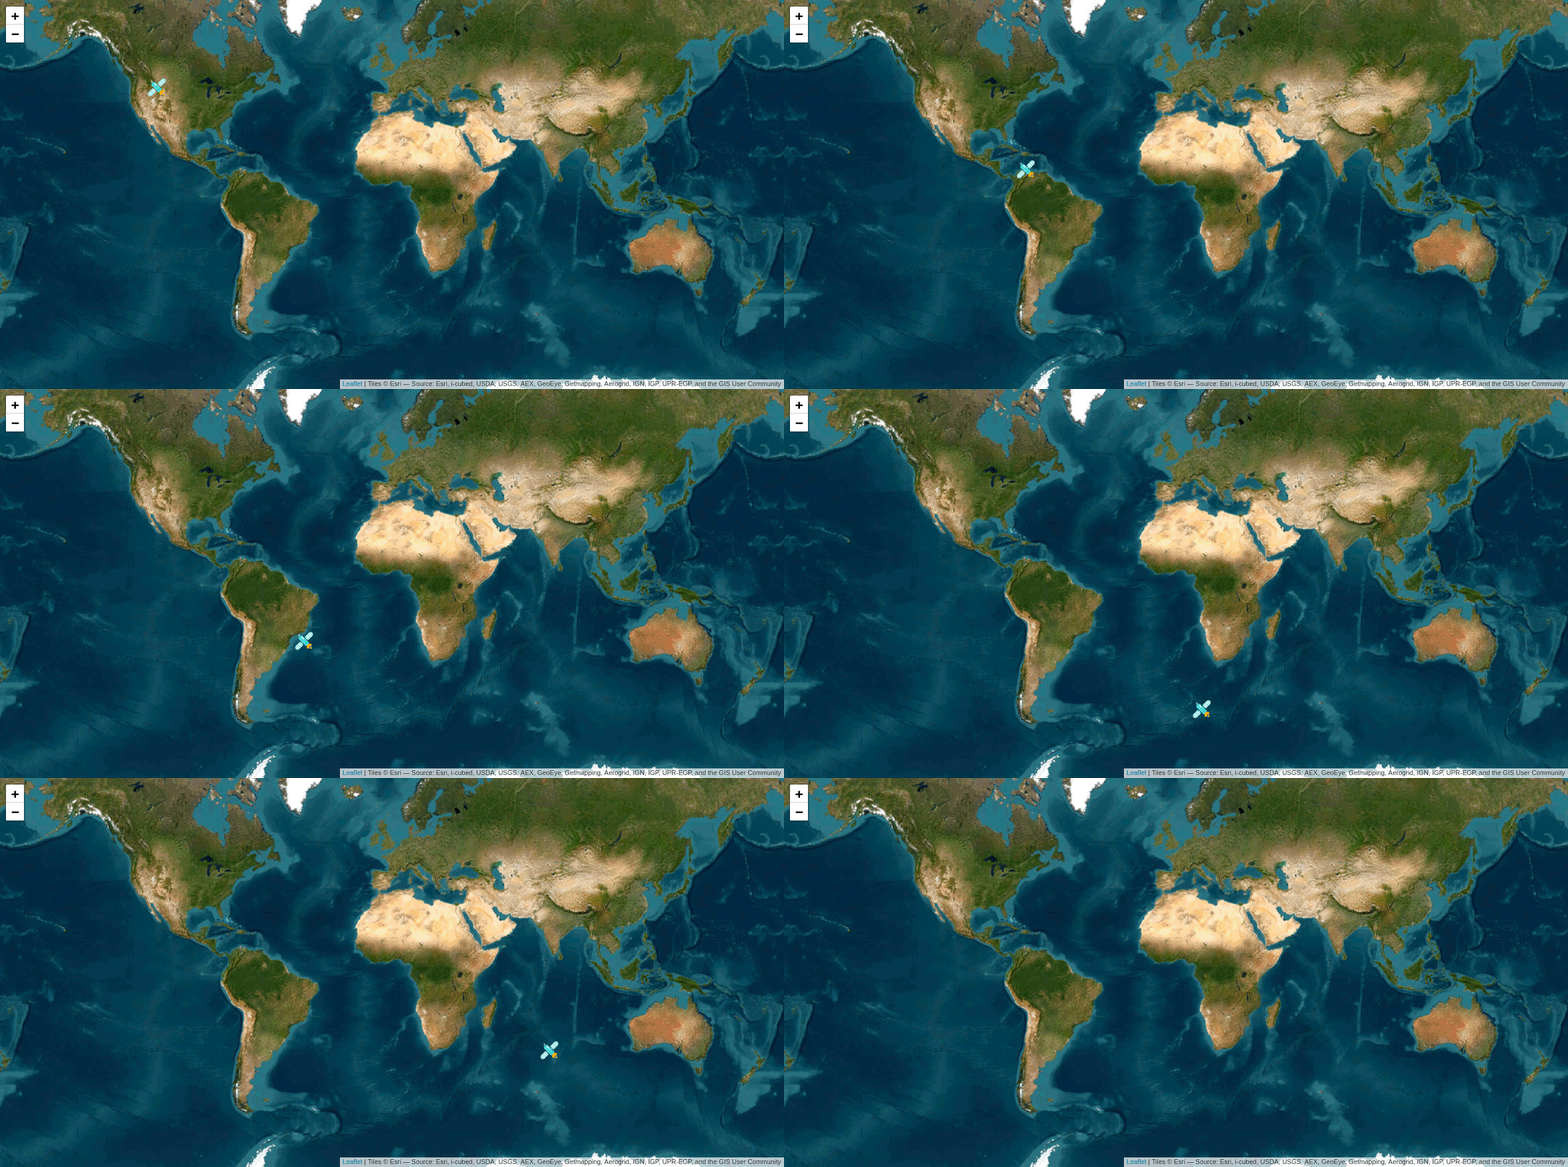
The code above depicts a simple Shiny app which consumes and displays the ISS data from Kafka. We set up a UI with the Leaflet map as a single output element. Then, in the server part of the app, we create the configuration for the Kafka Consumer class. The group.id resets whenever the app is started so that every instance of the app receives all data from the Kafka topic. We subscribe to the iss topic. In a reactive expression we consume messages with a timeout of 5 seconds. By using the invalidateLater function we achieve that the reactive expression is executed again immediately. We render the Leaflet map once and update the marker using an observer as soon as new location pairs come in. When the app is shut down we also close the connection to the Kafka server.
And this is how the output of our app will look like:

Using the Package
You can try kafka yourself by visiting our public repository here. The README includes detailed instructions on setting up a Kafka cluster, as well as producing and consuming messages in general. You will also find the code shown here and a slightly more advanced version.
Summary
In this post, we introduced kafka, a package designed to bridge the gap for R-based Kafka integrations. We demonstrated the production and consumption of real-time ISS location data. With replication and retention features, Kafka ensures data integrity even in the event of broker failures, making it a powerful tool for real-time applications. We invite you to explore the kafka package and see how it can enhance your data streaming workflows in R.